Rethinking GDP: Improving Economic Measurements
980 likes | 1.09k Vues
Explore the flaws in GDP as an economic welfare indicator, learn about GNP, Net Factor Payments, and how to calculate GDP accurately for a better evaluation of economic well-being.

Rethinking GDP: Improving Economic Measurements
E N D
Presentation Transcript
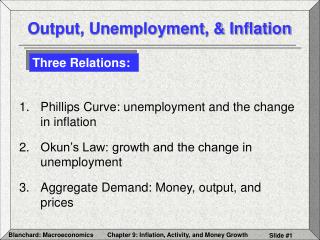
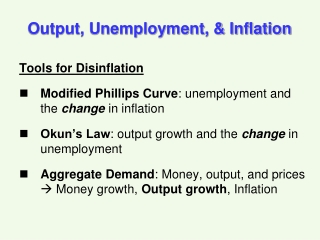
Output and Inflation Are We Measuring Them Correctly?
Measuring Economic Welfare • The standard benchmark for economic well being is Gross Domestic Product (GDP)
Measuring Economic Welfare • The standard benchmark for economic well being is Gross Domestic Product (GDP) • GDP is defined as the current market value of all goods and services produced within a country’s borders during a fixed time period (the BEA measures GDP on a quarterly basis)
Measuring Economic Welfare • The standard benchmark for economic well being is Gross Domestic Product (GDP) • GDP is defined as the current market value of all goods and services produced within a country’s borders during a fixed time period (the BEA measures GDP on a quarterly basis) • Is GDP an adequate measure of economic well being?
GDP vs. GNP • While GDP allocates production based on location, GNP (Gross National Product) allocates production based on nationality
GDP vs. GNP • While GDP allocates production based on location, GNP (Gross National Product) allocates production based on nationality • GNP is defined as the total market value of goods and services produced by a country’s citizens
GDP vs. GNP • While GDP allocates production based on location, GNP (Gross National Product) allocates production based on nationality • GNP is defined as the total market value of goods and services produced by a country’s citizens • GDP = GNP – Net Factor Payments
Example: GNP vs. GDP • Suppose that Toyota has a plant in Ohio producing $100M worth of cars per year. Toyota’s labor costs are $70M per year.
Example: GNP vs. GDP • Suppose that Toyota has a plant in Ohio producing $100M worth of cars per year. Toyota’s labor costs are $70M per year. • Meanwhile, Nike has a plant in Singapore producing $200M worth of sneakers per year. Nike’s labor costs are $10M per year
Example: GNP vs. GDP • Suppose that Toyota has a plant in Ohio producing $100M worth of cars per year. Toyota’s labor costs are $70M per year. • Meanwhile, Nike has a plant in Singapore producing $200M worth of sneakers per year. Nike’s labor costs are $10M per year • There is $300M in total production. How much does the US get credit for?
GDP in the US would include the entire $100M worth of cars, but none of the $200M in sneakers. Example: GNP vs. GDP
GDP in the US would include the entire $100M worth of cars, but none of the $200M in sneakers. GNP would count the $70M earned by US workers plus the $190M earned by Nike shareholders abroad for a total of $260M Example: GNP vs. GDP
GDP in the US would include the entire $100M worth of cars, but none of the $200M in sneakers. GNP would count the $70M earned by US workers plus the $190M earned by Nike shareholders abroad for a total of $260M Net Factor Payments are equal to income earned abroad by US citizens minus income earned by foreign citizens in the US Example: GNP vs. GDP
GDP in the US would include the entire $100M worth of cars, but none of the $200M in sneakers. GNP would count the $70M earned by US workers plus the $190M earned by Nike shareholders abroad for a total of $260M Net Factor Payments are equal to income earned abroad by US citizens minus income earned by foreign citizens in the US In the case, NFP = $190M - $30M = $160M Example: GNP vs. GDP
GDP in the US would include the entire $100M worth of cars, but none of the $200M in sneakers. GNP would count the $70M earned by US workers plus the $190M earned by Nike shareholders abroad for a total of $260M Net Factor Payments are equal to income earned abroad by US citizens minus income earned by foreign citizens in the US In the case, NFP = $190M - $30M = $160M Recall, GDP = GNP - NFP Example: GNP vs. GDP
Calculating GDP • Rule #1: Be sure and count everything!
Calculating GDP • Rule #1: Be sure and count everything! • Rule #2: Don’t count anything more than once!
There are two farmers: one farmer produces 1,000 bushels of oranges while the other produces 2,000 bushels of apples Calculating GDP: An easy example
There are two farmers: one farmer produces 1,000 bushels of oranges while the other produces 2,000 bushels of apples Apples cost $3/Bushel and oranges cost $2/Bushel Calculating GDP: An easy example
There are two farmers: one farmer produces 1,000 bushels of oranges while the other produces 2,000 bushels of apples Apples cost $3/Bushel and oranges cost $2/Bushel 1,000 x $2 = $2,000 + 2,000 x $3 = $6,000 GDP = $8,000 Calculating GDP: An easy example
Intel produces 1,000 computer chips (P = $100). Intel sells 900 of these chips to Dell and the remaining 100 directly to consumers. A more complicated example
Intel produces 1,000 computer chips (P = $100). Intel sells 900 of these chips to Dell and the remaining 100 directly to consumers. Dell uses 500 chips to produce 500 computers (P=$1,000) which are sold to consumers. A more complicated example
Intel produces 1,000 computer chips (P = $100). Intel sells 900 of these chips to Dell and the remaining 100 directly to consumers. Dell uses 500 chips to produce 500 computers (P=$1,000) which are sold to consumers. 1,000 x $100 = $100,000 + 500 x $1,000 = $500,000 GDP = $600,000? A more complicated example
Intel produces 1,000 computer chips (P = $100). Intel sells 900 of these chips to Dell and the remaining 100 directly to consumers. Dell uses 500 chips to produce 500 computers (P=$1,000) which are sold to consumers. 1,000 x $100 = $100,000 + 500 x $1,000 = $500,000 GDP = $600,000? $50, 000 worth of computer chips are already included in the value of the computers. Therefore, the above calculation counts them twice! A more complicated example
To avoid double counting, the output approach requires firms to report value added (value of output – value of inputs) The Output Approach
To avoid double counting, the output approach requires firms to report value added (value of output – value of inputs) Note, however, that Dell actually has two types of output: consumer goods (computers) and inventories (remaining computer chips) The Output Approach
To avoid double counting, the output approach requires firms to report value added (value of output – value of inputs) Note, however, that Dell actually has two types of output: consumer goods (computers) and inventories (remaining computer chips) Intel: $100,000 - $0 $100,000 Dell: $500,000 + $40,000 - $90,000 $450,000 Total = $550,000 The Output Approach
The expenditure approach recognizes that ALL produced output is purchased by someone The expenditure approach
The expenditure approach recognizes that ALL produced output is purchased by someone Expenditures are roughly classified as consumer expenditures, business investment, government purchases, exports, and imports The expenditure approach
The expenditure approach recognizes that ALL produced output is purchased by someone Expenditures are roughly classified as consumer expenditures, business investment, government purchases, exports, and imports Y = C + I + G + (X-M) Intel: $0 Dell: $40,000 (Inventory Investment) Consumers: $500,000 + $10,000 $510,000 Total: $550,000 The expenditure approach
The income approach • The value added produced in an economy will accrue to someone in the form of income
The income approach • The value added produced in an economy will accrue to someone in the form of income • In the previous example, the $100,000 of value added from Intel plus the $450,000 of value added from Dell will accrue to either Intel and Dell workers in the form of wages, or the owners (shareholders) of Intel and Dell in the form of corporate profits.
The income approach • The value added produced in an economy will accrue to someone in the form of income • In the previous example, the $100,000 of value added from Intel plus the $450,000 of value added from Dell will accrue to either Intel and Dell workers in the form of wages, or the owners (shareholders) of Intel and Dell in the form of corporate profits. • The broad classifications of income are: wages, proprietor income, corporate profits, rental income, and interest.
The income approach • The value added produced in an economy will accrue to someone in the form of income • In the previous example, the $100,000 of value added from Intel plus the $450,000 of value added from Dell will accrue to either Intel and Dell workers in the form of wages, or the owners (shareholders) of Intel and Dell in the form of corporate profits. • The broad classifications of income are: wages, proprietor income, corporate profits, rental income, and interest. • Output = Expenditures = C + I + G + NX
Flow of Funds • Recall that Y = C + I + G + NX (Output = Expenditures) • Further, Y = C + S + T (Income = Outlays)
Flow of Funds • Recall that Y = C + I + G + NX (Output = Expenditures) • Further, Y = C + S + T (Income = Outlays) C + S + T = C + I + G + NX
Flow of Funds • Recall that Y = C + I + G + NX (Output = Expenditures) • Further, Y = C + S + T (Income = Outlays) C + S + T = C + I + G + NX S = I + (G-T) + NX
The NIPA Accounts • Begun in the 1930’s, the National Income and Product Accounts are calculated on a quarterly basis by the Bureau of Economic Analysis (A division of the Department of Commerce) • The “Advance” estimates are released approximately 1 month after the end of the quarter, followed by the “Preliminary” revision (1 month later) and the “Final” Revision (2 months later) • Even after the Final release, the data is revised annually for 2 years and undergoes a comprehensive revision after 5 years
Output Equals Income (Almost) GDP ($11,649.3) + Net Factor Payments ($73.5) GNP ($11,722.8)
Output Equals Income (Almost) GDP ($11,649.3) + Net Factor Payments ($73.5) GNP ($11,722.8) • Depreciation ($1,370.1) Net National Product ($10,352.7)
Output Equals Income (Almost) GDP ($11,649.3) + Net Factor Payments ($73.5) GNP ($11,722.8) • Depreciation ($1,370.1) Net National Product ($10,352.7) • Indirect Taxes ($834.4) National Income ($9518.3)
Does GDP accurately reflect well being? • GDP in 2003 is $10,688.4 Billion while GDP in 1950 was $275.7 Billion. (an increase of 3800%). Are we 38 times as well off now than we were in 1950?
Does GDP accurately reflect well being? • GDP in 2003 is $10,688.4 Billion while GDP in 1950 was $275.7 Billion. (an increase of 3800%). Are we 38 times as well off now than we were in 1950? • Real GDP (1996 $s) in 2003 was $9,562.9 Billion while Real GDP in 1950 was $1,610.5 Billion (A 600% increase). Are Americans 6 times as well of now compared to 1950?
Does GDP accurately reflect well being? • GDP in 2003 is $10,688.4 Billion while GDP in 1950 was $275.7 Billion. (an increase of 3800%). Are we 38 times as well off now than we were in 1950? • Real GDP (1996 $s) in 2003 was $9,562.9 Billion while Real GDP in 1950 was $1,610.5 Billion (A 600% increase). Are Americans 6 times as well of now compared to 1950? • Real GDP per capita in 2003 is $36,911 compared to $10,736 in 1950 ( a 350% increase). Are we 3.5 times better off?
Does GDP accurately reflect well being? • GDP in 2003 is $10,688.4 Billion while GDP in 1950 was $275.7 Billion. (an increase of 3800%). Are we 38 times as well off now than we were in 1950? • Real GDP (1996 $s) in 2003 was $9,562.9 Billion while Real GDP in 1950 was $1,610.5 Billion (A 600% increase). Are Americans 6 times as well of now compared to 1950? • Real GDP per capita in 2003 is $36,911 compared to $10,736 in 1950 ( a 350% increase). Are we 3.5 times better off? • Median real income in 2003 is approximately $24,000 while median real income in 1950 was approximately $8,000 (a 300% increase)