IRI Climate Forecasting System in 2008
IRI Climate Forecasting System in 2008. Purely Empirical (observational) approach: El Nino Probabilistic Composite. Mason & Goddard, 2001, Bull.Amer.Meteor.Soc. Correlation Skill for NINO3 forecasts. Correlation Skill for NINO3 forecasts.

IRI Climate Forecasting System in 2008
E N D
Presentation Transcript
IRI Climate Forecasting System in 2008
Purely Empirical (observational) approach: El Nino Probabilistic Composite Mason & Goddard, 2001, Bull.Amer.Meteor.Soc.
Correlation Skill for NINO3 forecasts Correlation Skill for NINO3 forecasts Correlation Skill for NINO3 Forecasts Made by an Intermediate Coupled Prediction Model low medium good
Models say that neutral ENSO conditions are most likely for the rest of 2008 and into 2009.
IRI forecasters use the ENSO forecast models, and recent observations of the ENSO system, and assign probabilities to the forecasts for ENSO conditions.
Last week’s SST anomaly | | | | | | | | | | | --------------------------------------------------------------------
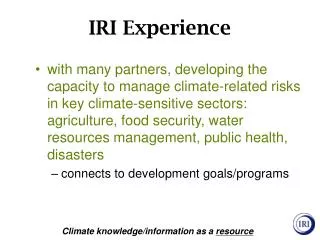
IRI’s Forecast System IRI is presently (in 2008) using a 2-tiered prediction system to probabilistically predict global temperature and precipitation with respect to terciles of the historical climatological distribution. We are interested in utilizing fully coupled (1-tier) systems also, and are looking into incorporating those. Within the 2-tiered system IRI uses 4 SST prediction scenarios, and combines the predictions of 7 AGCMs. The merging of 7 predictions into a single one uses two multi-model ensemble systems: Bayesian and canonical variate. These give somewhat differing solutions, and are presently given equal weight.
IRI DYNAMICAL CLIMATE FORECAST SYSTEM 2-tiered OCEAN ATMOSPHERE GLOBAL ATMOSPHERIC MODELS ECPC(Scripps) ECHAM4.5(MPI) CCM3.6(NCAR) NCEP(MRF9) NSIPP(NASA) COLA2 GFDL PERSISTED GLOBAL SST ANOMALY Persisted SST Ensembles 3 Mo. lead 10 POST PROCESSING MULTIMODEL ENSEMBLING 24 24 10 FORECAST SST TROP. PACIFIC: THREE (multi-models, dynamical and statistical) TROP. ATL, INDIAN (ONE statistical) EXTRATROPICAL (damped persistence) 12 Forecast SST Ensembles 3/6 Mo. lead 24 model weighting 24 30 12 30 30
IRI DYNAMICAL CLIMATE FORECAST SYSTEM 2-tiered OCEAN ATMOSPHERE MULTIPLE GLOBAL ATMOSPHERIC MODELS ECPC(Scripps) ECHAM4.5(MPI) CCM3.6(NCAR) NCEP(MRF9) NSIPP(NASA) COLA2 GFDL PERSISTED GLOBAL SST ANOMALY FORECAST SST TROP. PACIFIC:THREE scenarios: 1) Average of predictions of CFS (NCEP), LDEO5 (Lamont) and Constructed Analog (statistical; NCEP/CPC) 2) same as 1), plus an uncertainty pattern 3) same as 1), minus an uncertaintypattern TROP. ATL, and INDIAN oceans Same as Pacific, without LDEO5 and with statistical (CCA) forecast for Indian Oc. EXTRATROPICAL damped persistence
Method of Forming 3 SST Predictions for Climate Predictions damped persistence -------------------------------------------------- 0.25 NCEP CFS CPC CA IRI CCA 3 scenarios NCEP CFS Model LDEO Model CPC Constructed Analog (CA): (1)mean, (2)mean+, (3) mean- NCEP CFS CPC CA 3 scenarios ----------------------------------------------------------------------- damped persistence For each ocean basin, the 3 SST scenarios are (1) mean of the models used for that basin, (2) mean+p and (3) mean-p p is uncertainty factor from 1st EOF of model historical error
Method of Forming 4th SST Prediction for Climate Predictions (4)Anomaly persistence from most recently observed month (all oceans) (only used for the first lead time)
Collaboration on Input to Forecast Production Sources of the Global Sea Surface Temperature Forecasts Tropical Pacific Tropical Atlantic Indian Ocean Extratropical Oceans NCEP Coupled CPTEC Statistical IRI Statistical Damped PersistenceLDEO Coupled Constr Analogue Atmospheric General Circulation Models Used in the IRI's Seasonal Forecasts, for Superensembles Name Where Model Was Developed Where Model Is Run NCEP MRF-9 NCEP, Washington, DC QDNR, Queensland, AustraliaECHAM 4.5 MPI, Hamburg, Germany IRI, Palisades, New YorkNSIPP NASA/GSFC, Greenbelt, MD NASA/GSFC, Greenbelt, MDCOLA COLA, Calverton, MD COLA, Calverton, MD ECPC SIO, La Jolla, CA SIO, La Jolla, CA CCM3.6 NCAR, Boulder, CO IRI, Palisades, New York GFDL GFDL, Princeton, NJ GFDL, Princeton, NJ
IRI’s monthly issued probability forecasts of seasonal global precipitation and temperature We issue forecasts at four lead times. For example: NOV | Dec-Jan-Feb Jan-Feb-Mar Feb-Mar-Apr Mar-Apr-May Forecast models are run 7 months into future. Observed data are available through the end of the previous month (end of October in example above). Probabilities are given for the three tercile-based categories of the climatological distribution.
Forecasts of the climate The tercile category system: Below, near, and above normal Probability: 33% 33% 33% Below| Near | Below| Near | Above Below| Near | | || ||| ||||.| || | | || | | | . | | | | | | | | | | Data: 0 10 20 30 40 50 60 70 80 90 100 110 120 130 140 150 160 170 180 190 200 Rainfall Amount (tenths of inch) (30 years of historical data for a particular location & season) (Presently, we use 1970-2000)
Probability of above normal, near normal, and below normal rainfall, based on observations during 1970-2000
Favorable results of application of Bayesian consolidation are evidenced in an analysis of reliability (the correspondence between forecast probability and relative observed frequency of occurrence). Simple pooling (assignment of equal weights to all AGCMs) gives more reliability than that of individual AGCMs, but the Bayesian method results in still much more reliability. Note that flattish lines show model overconfidence; 45º line shows perfect reliability. Above-Normal Below-Normal Bayesian Pooled Observed relative Freq. Observed relative Freq. Individual AGCM Forecast probability Forecast probability (3-model) JAS Precipitation, 30S-30N See also Barnston et al. (2003), Bull. Amer. Meteor. Soc., 1783-1796, Fig 7 (page 1793). from Goddard et al. 2003 EGS-AGU-EGU Joint Assembly, Nice, France, 7-11 April
Historical skill using actually observed SST Ensemble mean (10 members)
Historical skill using actually observed SST Ensemble mean (24 members)
Indonesia Australia/ Indonesia OND Precip 1950- 2000 Uses actually observed SSTs North America Europe Tropical Americas South America
Ranked Probability Skill Score (RPSS) 3 probprob RPSfcst = (Fcsticat – Obsicat)2 icat=1 icat ranges from 1 (below normal) to 3 (above normal) icat is cumulative, from 1 to icat RPSS = 1 - (RPSfcst / RPSclim) RPSclim is RPS of forecasts of climatology (33%,33%,33%)
Cumulative Shown in Table Probability forecast (B,N,A): .20 .40 .40 XXXX XXXX XXXX XXXX XXXX XXXX XXXX XXXX XXXX XXXX XXXX XXXX XXXX XXXX XXXX XXXX XXXX XXXX XXXX XXXX XXXX XXXX XXXX XXXX XXXX XXXX XXXX XXXX RPS(fcst) = (.20 - .00)2 + (.60 – 1.00)2 + (1.00-1.00)2 = .04 + .16 = .20 : RPS(clim) = (.333 - .00)2 + (.667 – 1.00)2 + (1.00-1.00)2 = .111 + .111 = .2222 RPSS = 1 – (.20 / .222) = .10 .00 1.00 .00 Observation “Probability”(N occurred)
Real-time Forecast Skill (from Goddard et al. 2003, BAMS, p1761)
Sahel Precipitation 11 - 19N, 19W – 29E Nino3.4 SST / 10 Nino34 Lead 1 Lead 2 Lead 3 Lead 4 RPSS | | | | | | | | | | | | 1998 | 1999 | 2000 | 2001 | 2002 | 2003 | 2004 | 2005 | 2006 | 2007 | 2008
Sahel Precipitation (only MJJ,JJA,JAS,ASO) 11 - 19N, 19W – 29E Nino3.4 SST / 10 Nino34 Lead 1 Lead 2 Lead 3 Lead 4 RPSS | | | | | | | | | | | | 1998 | 1999 | 2000 | 2001 | 2002 | 2003 | 2004 | 2005 | 2006 | 2007 | 2008
OND 1997 to MJJ 2008: first lead time Frequency of issuance
IRI’s Africa forecast from May 2008
Sahel to Red Sea Precipitation 11 - 19N, 19W – 46E Nino3.4 SST / 10 Nino34 Lead 1 Lead 2 Lead 3 Lead 4 RPSS | | | | | | | | | | | | 1998 | 1999 | 2000 | 2001 | 2002 | 2003 | 2004 | 2005 | 2006 | 2007 | 2008
Sahel to Red Sea Precipitation (MJJ,JJA,JAS,ASO) 11 - 19N, 19W – 46E Nino3.4 SST / 10 Nino34 Lead 1 Lead 2 Lead 3 Lead 4 RPSS | | | | | | | | | | | | 1998 | 1999 | 2000 | 2001 | 2002 | 2003 | 2004 | 2005 | 2006 | 2007 | 2008
Greater Horn of Africa Precipitation 9N – 9S, 31 – 51E Nino3.4 SST / 10 Nino34 Lead 1 Lead 2 Lead 3 Lead 4 RPSS | | | | | | | | | | | | 1998 | 1999 | 2000 | 2001 | 2002 | 2003 | 2004 | 2005 | 2006 | 2007 | 2008
Greater Horn of Africa Precipitation (JJA,JAS,ASO,SON,OND,NDJ,DJF) 9N – 9S, 31 – 51E Nino3.4 SST / 10 Nino34 Lead 1 Lead 2 Lead 3 Lead 4 RPSS | | | | | | | | | | | | 1998 | 1999 | 2000 | 2001 | 2002 | 2003 | 2004 | 2005 | 2006 | 2007 | 2008
Southern Africa Precipitation 1 – 34S, 9 – 54E Nino3.4 SST / 10 Nino34 Lead 1 Lead 2 Lead 3 Lead 4 RPSS | | | | | | | | | | | | 1998 | 1999 | 2000 | 2001 | 2002 | 2003 | 2004 | 2005 | 2006 | 2007 | 2008
Southern Africa Precipitation 1 – 34S, 9 – 54E (OND,NDJ,DJF,JFM) Nino3.4 SST / 10 Nino34 Lead 1 Lead 2 Lead 3 Lead 4 RPSS | | | | | | | | | | | | 1998 | 1999 | 2000 | 2001 | 2002 | 2003 | 2004 | 2005 | 2006 | 2007 | 2008
25N – 25S Nino3.4 SST / 10 Nino34 Lead 1 Lead 2 Lead 3 Lead 4 | | | | | | | | | | | | 1998 | 1999 | 2000 | 2001 | 2002 | 2003 | 2004 | 2005 | 2006 | 2007 | 2008
Real-time Forecast Skill (from Goddard et al. 2003, BAMS, p1761
IRI Forecast Information Pages on the Web IRI Home Page: http://iri.columbia.edu/ ENSO Quick Look: http://iri.columbia.edu/climate/ENSO/currentinfo/QuickLook.html IRI Probabilistic ENSO Forecast: http://iri.columbia.edu/climate/ENSO/currentinfo/figure3.html Current Individual Numerical Model Climate Forecasts http://iri.columbia.edu/forecast/climate/prec03.html Individual Numerical Model Hindcast Skill Maps http://iri.columbia.edu/forecast/climate/skill/SkillMap.html Current Multi-model Climate Forecasts http://iri.columbia.edu/forecast/climate/multi_model2003.html