Download
1 / 49
490 likes | 513 Vues
Explore the evolving landscape of hematopoietic stem cell transplantation from 1980-2009, focusing on donor types, transplant activities, sources, and outcomes across different age groups in North America and globally.

E N D
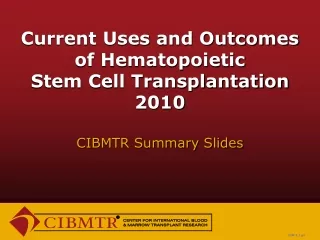
Current Uses and Outcomes of Hematopoietic Stem Cell Transplantation2010 CIBMTR Summary Slides SUM10_1.ppt
. . . . . . . . . . . . . . . . . . . . . . . . . . . . . . . . . . . . . . . . . . . . . . . . . . . . . . . . . . . . . . . . . . . . . . . . . . . . . . . . . . . . . . . . . . . . . . . . . . . . . . . . . . . . . . . . . . . . . . . . . . . . . . . . . . . . . . . . . . . . . . . . . . . . . . . . . . . . . . . . . . . . . . . . . . . . . . . . . . . . . . . . . . . . . . . . . . . . . . . . . . . . . . . . . . . . . . . . . . . . . . . . . . . . . . . . . . . . . . . . . . . . . . . . . . . . Location of transplant centers participating in CIBMTR2008 . . . . . . . . . . . . . . . . . . . . . . . Slide 2 SUM10_2.ppt
Transplant activity worldwide1980-2009 35,000 Autologous Allogeneic 30,000 25,000 20,000 Transplants 15,000 10,000 5,000 0 '80 '81 '82 '83 '84 '85 '86 '87 '88 '89 '90 '91 '92 '93 '94 '95 '96 '97 '98 '99 '00 '01 '02 '03 '04 '05 '06 '07 '08 '09 Slide 3 SUM10_3.ppt
Transplant activity in the U.S.1980-2009 18,000 Autologous Related Donor Unrelated Donor 16,000 14,000 12,000 10,000 Transplants 8,000 6,000 4,000 2,000 0 '80 '81 '82 '83 '84 '85 '86 '87 '88 '89 '90 '91 '92 '93 '94 '95 '96 '97 '98 '99 '00 '01 '02 '03 '04 '05 '06 '07 '08 '09 Slide 4 SUM10_4.ppt
Allogeneic stem cell sources,by recipient age1999-2008 100 Bone Marrow (BM) Peripheral Blood (PB) Cord Blood (CB) 80 60 Transplants, % 40 20 0 1999-2003 2004-2008 1999-2003 2004-2008 Age £20 yrs Age >20 yrs Slide 5 SUM10_7.ppt
Autologous stem cell sources,by recipient age1999-2008 100 Bone Marrow (BM) Peripheral Blood (PB) BM + PB 80 60 Transplants, % 40 20 0 1999-2003 2004-2008 1999-2003 2004-2008 Age £20 yrs Age >20 yrs Slide 6 SUM10_8.ppt
Trends in transplantation,by transplant type and recipient age*1999-2008 100 £ 20 yrs 21-40 yrs 41-50 yrs 51-60 yrs > 60 yrs 80 60 Transplants, % 40 20 0 1999-2003 2004-2008 1999-2003 2004-2008 Allogeneic Transplants Autologous Transplants * Transplants for AML, ALL, NHL, Hodgkin Disease, Multiple Myeloma Slide 7 SUM10_9.ppt
Trends in transplantation,by transplant type and recipient age*1999-2008 100 < 50 years < 60 years ³ 50 years ³ 60 years 80 60 Transplants, % 40 20 0 1988-1994 1995-2001 2002-2008 1988-1994 1995-2001 2002-2008 Allogeneic Transplants Autologous Transplants * Transplants for AML, ALL, NHL, Hodgkin Disease, Multiple Myeloma Slide 8 SUM10_29.ppt
Indications for hematopoietic stem cell transplant in North America2008 5,500 Allogeneic (Total N=6,672) 5,000 Autologous (Total N=10,302) 4,500 4,000 3,500 3,000 Number of Transplants 2,500 2,000 1,500 1,000 500 0 Multiple NHL AML HD ALL MDS/MPD Aplastic CML Other Other Non- Myeloma Anemia Leuk Cancer Malig Disease Slide 9 SUM10_11.ppt
Indications for hematopoietic stem cell transplant for ages £20 years in North America2008 800 Allogeneic (Total N=1,496) 700 Autologous (Total N=880) 600 500 Number of Transplants Number of Transplants 400 300 200 100 0 Other ALL AML Aplastic HD NHL MDS/MPD CML Other Non- Cancer Anemia Leuk Malig Disease Slide 10 SUM10_12.ppt
Indications for allogeneic hematopoietic stem cell transplantation in North America2008 3,000 Related Donor (Total N=3,282) Unrelated Donor (Total N=3,389) 2,500 2,000 Number of Transplants 1,500 1,000 500 0 AML ALL MDS/MPD NHL Aplastic CML Multiple HD Other Other Non- Anemia Myeloma Leuk Cancer Malig Disease Slide 11 SUM10_13.ppt
Allogeneic transplants in patients £20 years,by donor type and graft source, registered with CIBMTR,1991-2008 5,000 Related, BM or PB Unrelated, BM or PB Unrelated, CB 4,500 4,000 3,500 3,000 Number of Transplants Number of Transplants 2,500 2,000 1,500 1,000 500 0 * * Data incomplete 1991-92 1993-94 1995-96 1997-98 1999-00 2001-02 2003-04 2005-06 2007-08 Slide 12 SUM10_14.ppt
Allogeneic transplant in patients >20 years,by donor type and graft source, registered with CIBMTR, 1991-2008 13,000 12,000 Related, BM or PB Unrelated, BM Unrelated, PB Unrelated, CB 11,000 10,000 9,000 8,000 7,000 Number of Transplants Number of Transplants 6,000 5,000 4,000 3,000 2,000 1,000 0 * * Data incomplete 1991-92 1993-94 1995-96 1997-98 1999-00 2001-02 2003-04 2005-06 2007-08 Slide 13 SUM10_15.ppt
Unrelated donor stem cell sourcesby recipient age1999-2008 100 Bone Marrow (BM) Peripheral Blood (PB) Cord Blood (CB) 80 60 Transplants, % 40 20 0 1999-2003 2004-2008 1999-2003 2004-2008 Age £20 yrs Age >20 yrs Slide 14 SUM10_16.ppt
Unrelated cord blood transplantationregistered with CIBMTR1999-2008 800 ³ 16 years < 16 years 700 600 500 Number of Transplants Number of Transplants 400 300 200 100 0 * * * Data incomplete 1999 2000 2001 2002 2003 2004 2005 2006 2007 2008 Slide 15 SUM10_17.ppt
One-year survival after myeloablative conditioning for acute leukemias in any remission phase, CML or MDS, age <50 years, by year of transplant and graft source, 1988-2008 100 Sibling Donor Unrelated Donor 80 60 One-Year Survival, % 40 20 0 1988-90 1991 1992 1993 1994 1995 1996 1997 1998 1999 2000 2001 2002 2003 2004 2005 2006 2007 2008 Slide 16 SUM10_18.ppt
100-day mortality after autologous transplantation2007-2008 15 Early Disease Intermediate/Advance Disease Sensitive Resistant Other 12 9 Mortality, % 6 3 0 Acute Leukemia Non-HodgkinLymphoma Hodgkin Disease MultipleMyeloma Slide 17 SUM10_19.ppt
100-day mortality after HLA-identical sibling transplantation2007-2008 100 Early Disease Intermediate Disease Advance Disease Chronic Phase Accelerated Phase Blast Phase Other 80 60 Mortality, % 40 20 0 AML ALL CML MDS/MPS AplasticAnemia Immune Deficiency Slide 18 SUM10_20.ppt
100-day mortality after unrelated donor transplantation2007-2008 100 Early Disease Intermediate Disease Advance Disease Chronic Phase Accelerated Phase Blast Phase Other 80 60 Mortality, % 40 20 0 AML ALL CML MDS/MPS AplasticAnemia Immune Deficiency Slide 19 SUM10_21.ppt
Causes of death after transplantations done in 2003-2008 Autologous Primary Disease IPn * (1%) (73%) Infection (5%) Organ Failure (4%) Other Cause (17%) HLA-identical sibling Primary Disease (43%) GVHD (10%) Unrelated donor IPn * (3%) Primary Disease GVHD (12%) (35%) Infection (14%) IPn * (5%) Organ Failure (8%) Other (22%) Infection (17%) Other Cause (19%) *IPn = Idiopathic pneumonia syndrome Slide 20 Organ Failure (12%) SUM10_22.ppt
Allogeneic transplantations by conditioning regimen intensity and patient age, registered with CIBMTR1999-2008 11,000 Reduced Intensity Conditioning, Age ³ 50 years Reduced Intensity Conditioning, Age < 50 years Standard Myeloablative Conditioning 10,000 9,000 8,000 7,000 6,000 Number of Transplants 5,000 4,000 3,000 2,000 1,000 0 * * * Data incomplete 1999 2000 2001 2002 2003 2004 2005 2006 2007 2008 Slide 21 SUM10_23.ppt
Allogeneic transplantations using reduced-intensity conditioning, by donor type, registered with CIBMTR1998-2008 3,000 Unrelated CB Unrelated PB/BM Related 2,500 2,000 Number of Transplants 1,500 1,000 500 0 * * * Data incomplete 1999 2000 2001 2002 2003 2004 2005 2006 2007 2008 Slide 22 SUM10_24.ppt
Number of allogeneic transplants, by disease, registered with CIBMTR 1998-2008 3,000 AML ALL CML AA LYM / MM / CLL 2,500 2,000 Transplants 1,500 1,000 500 0 * * * Data incomplete 1999 2000 2001 2002 2003 2004 2005 2006 2007 2008 Slide 23 SUM10_25.ppt
Number of allogeneic transplants for AML, by disease status, registered with CIBMTR1998-2008 1,400 Early Disease Intermediate Disease Advanced Disease 1,200 1,000 800 Transplants 600 400 200 0 * * * Data incomplete 1999 2000 2001 2002 2003 2004 2005 2006 2007 2008 Slide 24 SUM10_26.ppt
Number of allogeneic transplantations for ALL, by disease status, registered with CIBMTR 1998-2008 1,000 Early Disease Intermediate Disease Advanced Disease 800 600 Transplants 400 200 0 * * * Data incomplete 1999 2000 2001 2002 2003 2004 2005 2006 2007 2008 Slide 25 SUM10_27.ppt
100 100 90 90 80 80 70 70 60 60 50 50 40 40 30 30 20 20 10 10 0 0 Probability of survival after HLA-matched sibling donor transplant for AML, by disease status, 1998-2008 Early (N=6,898) Probability of Survival, % Intermediate (N=1,805) Advanced (N=3,011) P < 0.0001 1 3 0 2 4 5 6 Years Slide 26 SUM10_32.ppt
100 100 90 90 80 80 70 70 60 60 50 50 40 40 30 30 20 20 10 10 0 0 Probability of survival after unrelated donor transplant for AML, by disease status, 1998-2008 Early (N=3,658) Probability of Survival, % Intermediate (N=2,774) Advanced (N=3,242) P < 0.0001 1 3 0 2 4 5 6 Years Slide 27 SUM10_33.ppt
100 100 90 90 80 80 70 70 60 60 50 50 40 40 30 30 20 20 10 10 0 0 Probability of survival after HLA-matched sibling donor transplant for AML, age <20 years, by disease status, 1998-2008 Early (N=1,384) Probability of Survival, % Intermediate (N=285) Advanced (N=309) P < 0.0001 1 3 0 2 4 5 6 Years Slide 28 SUM09_34.ppt
100 100 90 90 80 80 70 70 60 60 50 50 40 40 30 30 20 20 10 10 0 0 Probability of survival after HLA-matched sibling donor transplant for AML with reduced-intensity conditioning, by disease status, 1998-2008 Probability of Survival, % Early (N=1,129) Intermediate (N=377) Advanced (N=571) P < 0.0001 1 3 0 2 4 5 6 Years Slide 29 SUM10_35.ppt
100 100 90 90 80 80 70 70 60 60 50 50 40 40 30 30 20 20 10 10 0 0 Probability of survival after unrelated donor transplant for AML with reduced-intensity conditioning, by disease status, 1998-2008 Probability of Survival, % Early (N=951) Intermediate (N=585) Advanced (N=728) P < 0.0001 1 3 0 2 4 5 6 Years Slide 30 SUM10_36.ppt
100 100 90 90 80 80 70 70 60 60 50 50 40 40 30 30 20 20 10 10 0 0 Probability of survival after autologous transplant for AML, by disease status, 1998-2008 Probability of Survival, % Early (N=2,319) Intermediate (N=769) Advanced (N=221) P < 0.0001 1 3 0 2 4 5 6 Years Slide 31 SUM10_38.ppt
100 100 90 90 80 80 70 70 60 60 50 50 40 40 30 30 20 20 10 10 0 0 Probability of survival after allogeneic transplant for MDS, age <20 years, by disease status and donor type, 1998-2008 Early, unrelated (N=145) Early, HLA-matched sibling (N=63) Advanced, HLA-matched sibling (N=114) Probability of Survival, % Advanced, unrelated (N=190) P = 0.002 1 3 0 2 4 5 6 Years Slide 32 SUM10_39.ppt
100 100 90 90 80 80 70 70 60 60 50 50 40 40 30 30 20 20 10 10 0 0 Probability of survival after allogeneic transplant for MDS, age ³20 years, by disease status and donor type, 1998-2008 Early, unrelated (N=509) Early, HLA-matched sibling (N=599) Probability of Survival, % Advanced, unrelated (N=1,142) Advanced, HLA-matched sibling (N=1,237) P < 0.0001 1 3 0 2 4 5 6 Years Slide 33 SUM10_40.ppt
100 100 90 90 80 80 70 70 60 60 50 50 40 40 30 30 20 20 10 10 0 0 Probability of survival after allogeneic transplant for MDS with reduced-intensity conditioning, by disease status and donor type, 1998-2008 Advanced, HLA-matched sibling (N=366) Early, HLA-matched sibling (N=217) Probability of Survival, % Early, unrelated (N=202) Advanced, unrelated (N=383) P < 0.0001 1 3 0 2 4 5 6 Years Slide 34 SUM10_41.ppt
100 100 90 90 80 80 70 70 60 60 50 50 40 40 30 30 20 20 10 10 0 0 Probability of survival after HLA-matched sibling donor transplant for ALL, age <20 years, by disease status, 1998-2008 Early (N=915) Probability of Survival, % Intermediate (N=1,313) Advanced (N=243) P < 0.0001 1 3 0 2 4 5 6 Years Slide 35 SUM10_42.ppt
100 100 90 90 80 80 70 70 60 60 50 50 40 40 30 30 20 20 10 10 0 0 Probability of survival after unrelated donor transplant for ALL, age <20 years, by disease status, 1998-2008 Early (N=831) Probability of Survival, % Intermediate (N=2,041) Advanced (N=340) P < 0.0001 1 3 0 2 4 5 6 Years Slide 36 SUM10_43.ppt
100 100 90 90 80 80 70 70 60 60 50 50 40 40 30 30 20 20 10 10 0 0 Probability of survival after HLA-matched sibling donor transplant for ALL, age ³20 years, by disease status, 1998-2008 Probability of Survival, % Early (N=1,993) Intermediate (N=700) Advanced (N=716) P < 0.0001 1 3 0 2 4 5 6 Years Slide 37 SUM10_44.ppt
100 100 90 90 80 80 70 70 60 60 50 50 40 40 30 30 20 20 10 10 0 0 Probability of survival after unrelated donor transplant for ALL, age ³20 years, by disease status, 1998-2008 Probability of Survival, % Early (N=1,363) Intermediate (N=934) Advanced (N=784) P < 0.0001 1 3 0 2 4 5 6 Years Slide 38 SUM09_45.ppt
100 100 90 90 80 80 70 70 60 60 50 50 40 40 30 30 20 20 10 10 0 0 Probability of survival after HLA-matched sibling donor transplant for CML, by disease status and transplant year, 1998-2008 CP, 2001-2008 (N=2,412) CP, 1998-2000 (N=2,302) Probability of Survival, % AP, 2001-2008 (N=314) AP, 1998-2000 (N=301) P < 0.0001 1 3 0 2 4 5 6 Years Slide 39 SUM10_46.ppt
100 100 90 90 80 80 70 70 60 60 50 50 40 40 30 30 20 20 10 10 0 0 Probability of survival after autologous and HLA-matched sibling donor transplants for CLL, 1998-2008 autologous transplant (N=399) Probability of Survival, % Myeloablative conditioning(N=458) Reduced-intensity conditioning (N=679) P < 0.0001 1 3 0 2 4 5 6 Years Slide 40 SUM10_47.ppt
100 100 90 90 80 80 70 70 60 60 50 50 40 40 30 30 20 20 10 10 0 0 Probability of survival after allogeneic transplant for severe aplastic anemia, by donor type and age, 1998-2008 HLA-matched sibling, £20 y (N=1,388) HLA-matched sibling, >20 y (N=1,408) Unrelated, £20 y (N=562) Probability of Survival, % Unrelated, >20 y (N=532) P < 0.0001 1 3 0 2 4 5 6 Years Slide 41 SUM10_48.ppt
100 100 90 90 80 80 70 70 60 60 50 50 40 40 30 30 20 20 10 10 0 0 Probability of survival after autologous transplant for Hodgkin disease, by disease status, 1998-2008 Complete remission (N=2,437) Not in CR, sensitive (N=3,237) Probability of Survival, % Not in CR, resistant (N=699) P < 0.0001 1 3 0 2 4 5 6 Years Slide 42 SUM10_49.ppt
100 100 90 90 80 80 70 70 60 60 50 50 40 40 30 30 20 20 10 10 0 0 Probability of survival after allogeneic transplant for Hodgkin disease, by donor type and conditioning regimen, 1998-2008 Unrelated, reduced-intensity conditioning (N=110) HLA-matched sibling, myeloablative (N=190) HLA-matched sibling, reduced-intensity conditioning (N=153) Probability of Survival, % Unrelated, myeloablative (N=71) P = 0.021 1 3 0 2 4 5 6 Years Slide 43 SUM10_50.ppt
100 100 90 90 80 80 70 70 60 60 50 50 40 40 30 30 20 20 10 10 0 0 Probability of survival after autologous transplant for follicular lymphoma, by disease status, 2000-2008 Chemosensitive (N=1,995) Probability of Survival, % Chemoresistant (N=160) P < 0.0001 1 3 0 2 4 5 6 Years Slide 44 SUM10_51.ppt
100 100 90 90 80 80 70 70 60 60 50 50 40 40 30 30 20 20 10 10 0 0 Probability of survival after HLA-matched sibling donor allogeneic transplant for follicular lymphoma, by disease status and conditioning regimen, 1998-2008 Chemosensitive, reduced–intensity conditioning (N=388) Chemosensitive, myeloablative (N=351) Chemoresistant, reduced–intensity conditioning (N=64) Probability of Survival, % Chemoresistant, myeloablative (N=85) P = 0.011 1 3 0 2 4 5 6 Years Slide 45 SUM10_52.ppt
100 100 90 90 80 80 70 70 60 60 50 50 40 40 30 30 20 20 10 10 0 0 Probability of survival after autologous transplant for diffuse large B-cell lymphoma, by disease status, 2000-2008 Chemosensitive (N=6,203) Probability of Survival, % Chemoresistant (N=447) P < 0.0001 1 3 0 2 4 5 6 Years Slide 46 SUM10_53.ppt
100 100 90 90 80 80 70 70 60 60 50 50 40 40 30 30 20 20 10 10 0 0 Probability of survival after HLA-matched sibling donor allogeneic transplant for diffuse large B-cell lymphoma, by disease status and conditioning regimen, 1998-2008 Probability of Survival, % Chemosensitive, reduced-intensity conditioning (N=122) Chemosensitive, myeloablative (N=315) Chemoresistant, reduced-intensity conditioning (N=43) Chemoresistant, myeloablative (N=98) P < 0.0001 1 3 0 2 4 5 6 Years Slide 47 SUM10_54.ppt
100 100 90 90 80 80 70 70 60 60 50 50 40 40 30 30 20 20 10 10 0 0 Probability of survival after transplant for mantle cell lymphoma, by donor type and conditioning regimen, 1998-2008 HLA-matched sibling, reduced-intensity conditioning (N=229) HLA-matched sibling, myeloablative (N=284) autologous transplant (N=2,390) Probability of Survival, % Unrelated, myeloablative (N=94) Unrelated, reduced-intensity conditioning (N=184) P < 0.0001 1 3 0 2 4 5 6 Years Slide 48 SUM10_55.ppt
100 100 90 90 80 80 70 70 60 60 50 50 40 40 30 30 20 20 10 10 0 0 Probability of survival after transplant for multiple myeloma, by donor type1998-2008 autologous transplant (N=22,254) Probability of Survival, % HLA-matched sibling, Allo (N=878) Unrelated, Allo (N=143) P < 0.0001 1 3 0 2 4 5 6 Years Slide 49 SUM10_56.ppt