
HYPOTHESIS TESTING PROCEDURE
A comprehensive guide on hypothesis testing procedure, including establishing hypotheses, significance levels, test planning, data collection, conclusion drawing, parameter estimation, with detailed formulas and examples. Master the process with this simple step-by-step tutorial.

HYPOTHESIS TESTING PROCEDURE
E N D
Presentation Transcript
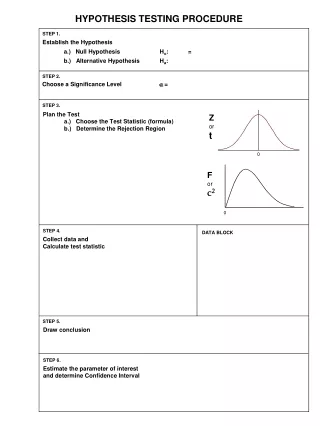
HYPOTHESIS TESTING PROCEDURE STEP 1. Establish the Hypothesis a.) Null Hypothesis Ho: = b.) Alternative Hypothesis Ha: STEP 2. Choose a Significance Level a = STEP 3. Plan the Test a.) Choose the Test Statistic (formula) b.) Determine the Rejection Region Z or t 0 F or c2 0 STEP 4. DATA BLOCK Collect data and Calculate test statistic STEP 5. Draw conclusion STEP 6. Estimate the parameter of interest and determine Confidence Interval
Hypothesis Tests - Tests for One Population Differences in the Means 2 Test To Use Formula s Population Variance ( ) known? - m Yes Z - Test x = 0 Z s / n where : x - Sample Me an m - Standard Mean 0 s - Population Standard Deviation n - Sample Size - m No t - Test x = 0 t s / n where : x - Sample Me an m - Standard Mean 0 s - Sample Standard Deviation n - Sample Size - Tests for Two Population s – Paired Data Differences in the Means Population Population Test to Formula Variances Variances Use known? Equal? N/A N/A Paired d = t Sample t - s / n Test where : d - Sample Differences Mean s - Sample Standard Deviation n - Sample Size
- Tests for Two Populations Differences in the Means Population Population Test to Formula Variances Variances Use known? Equal? Yes N/A Two Pop . For Equal Sample Sizes - Z - Test x x = A B Z 1 s + s 2 2 ( ) A B n where : x - Sample Mean i s - Population Standard Deviation i n - Sample Size For Unequal Sample Sizes - x x = A B Z s s 2 2 + A B n n A B where : x - Sample Mean i s - Population Standard Deviation i n - Sample Size i No Yes Two – For equal sample sizes - Pop. , x x = A B t Pooled + 2 2 s s Variance A B t - Test n where : x - Sample Mean i s - Sample Standard Deviation i n - Sample Size For unequal sample sizes - x x A B = t æ ö + SS SS 1 1 ç ÷ A B + + - è ø n n n n 2 A B A B where : x - Sample Me an i n - Sample Si ze i
- Tests for More than Two Populations Differences in the Means . Differences in the Dispersion Comparison Test To Formula Use 2 Population Variance to a c - - Test 2 ( n 1 ) s c = 2 Standard s 2 0 where : s - Sample Standard Deviation s - " Standard" or Population Standard Deviation 0 n - Sample Size Two Population F - Test = 2 2 F s s A B Variances where : s - Sample Standard Deviation i Differences in Proportions Comparison Test To Formula Use - Population Proportion to a Z - Test p P = 0 Z Standard - P ( 1 P ) / n 0 0 where : p - Sample Proportion n - Sample Size - Two Population Z - Test p p = 1 2 Z Proportions (2 Pop’s) é ù 1 1 - + p ( 1 p ) ê ú n n ë û 1 2 where : p - Sample Proportion i n - Sample Size i + x x 1 2 p = + n n 1 2 x - Number of Sample Items with Characteristic of Interest i


