Download
1 / 11
110 likes | 137 Vues
Explore how Sigvaris leveraged EiB analytics to streamline sales reporting, enabling personalized data access and analysis for better sales management. Learn about the benefits, future plans, and the shift from manual to efficient data handling.

E N D
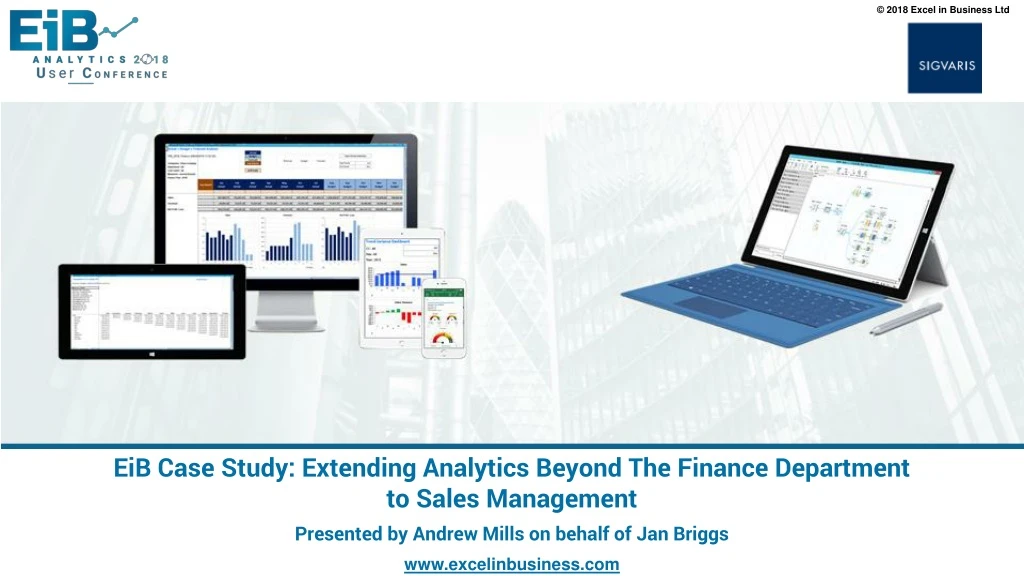
EiB Case Study: Extending Analytics Beyond The Finance Department to Sales Management Presented by Andrew Mills on behalf of Jan Briggs
Agenda • Sigvaris – An Overview • Disparate Data • Modular Information • The Old way • The Data Cube • Mixed reporting of the same data • User data manipulation • Analysing Sales • MI Partnership • Working With EiB • EIB Analytics Benefits • Future Enhancement Plans For MI
Sigvaris – An Overview • Global group • Established over 150 years ago, manufacturing compression hosiery for 60 years • 14 Sigvaris companies manufacture and distribute to over 70 countries across the world • The UK company sells over 28 ranges of compression hosiery (socks, stockings, tights, arm sleeves & gloves) • Each range has between 1 & 4 different compression classes, and up to 6 different colours • Each compression class has up to 12 different sizes and 3 different lengths • 9 Geographical territories in UK & Eire are each covered by A Business Development Manager
Disparate Data • Complexities – the result • Complex nature of our products results in approximately 18,000 individual product codes being held in the Sage 200 stock module, arranged in Product Groups • Sales results are assigned to each Business Development Manager by the delivery postcode of the customer • The problem • Sage 200 data is not accessible by the Business Development Managers, and even if it was they would need to be trained on an ERP system that they don’t really need to use • Reporting sales data therefore falls to the sales support person to produce weekly and monthly for each geographical area • Some 6-8 reports would have to be extracted from Sage 200 to Excel. Next they would need to be amalgamated and sorted to produce the kind of data that the sales team need in order to monitor and drive sales • That Excel effort is manual and costly in terms of time (approximately 5 days a month) • No flexibility of data and restricted reporting combinations • How accurate can manually manipulated be? How sure are we the figures are correct?
Disparate Data • Modular Information • Sage 200 is a modular ERP system – Sales Ledger, SOP, Stock • Sales information is contained within each of these modules, but not all information is in any one • The Old Way • The old way of running various Sage 200 reports and then using Excel to try to pull the information together has been not only very time consuming but could not be achieved by individual sales team members • Slow sales results and inability to analyse the complexities resulted in the sales team ‘running blind’ • The Data Cube • The EiB data cube seemed to be the best solution to a complex reporting problem • Each piece of data within the modules can be ‘pulled together’ in the cube, enabling each piece of information to be mixed with another to form individualised and meaningful reporting • Every sales team member can pull whatever type of data they need, in any sliced and diced way to help them focus on the weaknesses within their sales
Mixed reporting of the same data • User data manipulation • Sales data can be accessed individually by the sales team • A set of reports enable the user to choose basic financial data by comparing one period with another (month, year etc), or an overview of the whole year – but by their own territory • The reports are also set to show how they are doing against target to incentivise them, and more importantly to show where their sales are falling or increasing by the criteria they want to see • Analysing Sales – The View • By customer and then by product • Product and then by customer • By month, year or combination • Comparisons – month to month, year to year, by customer with drill down to specific sales data
Slicing and dicing Q: Within a given month, which products have been purchased by which customer, to what value? A: This report enables us to select a month, quarter or year, listed by sales area. The sales team member can then drill down to product range and then further to the sales data making up the total sales for that range in that period.
Slicing and dicing Q: What are my customers buying in comparison to the same period last/month/year? A: This report enables us to select a comparison by month or quarter or year, listed by sales area and customer type. The sales team can then drill down to customer spend and then further to the product data making up the total sales for that customer in each period.
Slicing and dicing Q: Which areas of the country are my sales going to, and which customers are buying? A: This report enables us to look at sales by sector for a given period in a given postcode. The drill down shows which customers have purchased those items.
MI Partnership • Working with EiB • Taking time to understand our business model and enough of the complexities to understand the results we’re aiming for, and working with the same senior consultant throughout the project has been the lynch pin to achieving this exceptional business tool • EiB Analytics Benefits • Sales team have the ability to run whatever report they require, in any combination of ways, for any date range, whenever is convenient to them. • Having live and accurate information available ahead of customer appointments, enables them to plan their forthcoming discussions and focus on the critical areas to improve sales • Future Enhancement Plans For MI • Dashboarding – our next step for quick and easy visual targets and achievements for the sales team
EiB Case Study: Extending Analytics Beyond The Finance Department to Sales Management Presented by Andrew Mills on behalf of Jan Briggs