Effects of H2O2, HNE, and SIN-1 on Insulin Secretion in INS-1 Cells
80 likes | 200 Vues
This study investigates the impact of oxidative stressors like hydrogen peroxide (H2O2), 4-hydroxynonenal (HNE), and SIN-1 on insulin secretion from INS-1 (832/13) cells. We explored how these agents influence insulin release in varying glucose concentrations. Our findings show that H2O2 affects insulin secretion, and the presence of calcium is critical for these effects. Additionally, we assessed the cytotoxicity of HNE, methylglyoxal (MGO), and arsenite, highlighting their impact on cell viability. The results indicate a strong link between oxidative stress and insulin secretion regulation.

Effects of H2O2, HNE, and SIN-1 on Insulin Secretion in INS-1 Cells
E N D
Presentation Transcript
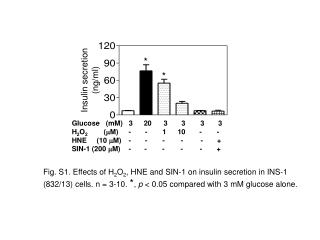
* * Insulin secretion (ng/ml) Glucose (mM) 3 20 3 3 3 3 H2O2 (mM) - - 1 10 - -HNE (10 mM) - - - - - + SIN-1 (200 mM) - - - - - + Fig. S1. Effects of H2O2, HNE and SIN-1 on insulin secretion in INS-1 (832/13) cells. n = 3-10. *, p < 0.05 compared with 3 mM glucose alone.
Insulin secretion (ng/ml) Glucose (mM) 3 20 3 33 3 H2O2 (µM) - - 12 4 8 Fig. S2. Ca2+-free conditions prevent H2O2-stimulated insulin secretion and GSIS in INS-1(832/13) cells. Cells were pre-incubated with Ca2+-free Kreb’s buffer (140 mM NaCl, 30 mM HEPES, 4.6 mM KCl, 1 mM MgSO4, 0.15 mM Na2HPO4, 5 mM NaHCO3, 100 µM EGTA and 0.05% BSA, pH 7.4) containing 3 mM glucose for 30 min. Then the buffers were replaced with Ca2+-free Krebs’ buffer containing secretagogues and followed by a 30 min-incubation. n = 4.
% B/B0 Log (ng/ml) Fig. S3. NAC and DEM do not interfere with the insulin RIA.
A B C % of control HNE (µM) MGO (µM) Arsenite (µM) D % of control Arsenite (µM) Fig. S4. Cytotoxicity of HNE, MGO and arsenite in INS-1 (832/13) cells and isolated mouse islets. Cell viability was measured by MTT assay. (A-C) INS-1 (832/13) cells were cultured on 96-wells plate overnight and followed by treatment with the agents for 24 hrs; D. Isolated islets (20 islets/well) were incubated with arsenite for 24 hrs and viability was measured.
A B H2O2 levels (fluorescence intensity) Glucose (mM) Incubation time (min) Fig. S5. Glucose autoxidation is a powerful source of H2O2 generation in vitro. A) Glucose dose-dependently increases H2O2 production in PBS or Kreb’s buffer. Different concentrations of glucose were incubated in PBS or Kreb’s bufferat 37˚C for 30 min. The H2O2 levels were measured using Amplex Red Hydrogen Peroxide/ Peroxidase Assay Kit (Molecular Probes) and the fluorescence intensity (λEx = 545 nm; λEm = 590 nm) was measured by VICTOR 3 1420 Multilabel Counter (Perkin Elmer, Finland). Kreb’s, glucose was incubated in Kreb’s buffer; PBS, glucose was incubated in PBS; Kreb’s+CAT, glucose was incubated in Kreb’s buffer containing 20 U/ml of catalase; PBS+CAT, glucose was incubated in PBS containing 20 U/ml of catalase. B) Glucose time-dependently increases H2O2 production in PBS. 20 mM glucose+CAT, 20 mM glucose was incubated in PBS containing 20 U/ml of catalase.
A B 3 mM glucose 3 mM glucose 20 mM glucose 20 mM glucose Cellular ATP (nmol/mg protein) * # H2O2 accumulation (Fluorescence intensity) # * * * # # * * * # Cont Rot Ant Oli Cont Rot Ant Oli C 3 mM glucose 20 mM glucose * Insulin secretion (ng/ml) # # # Cont Rot Ant Oli Fig. S6.Block of mitochondrial electron transport chain results in H2O2 accumulation, decreased ATP generation and impaired GSIS in INS-1 (832/13) cells. Rot, rotenone, a complex I inhibitor; Ant, antimycin A, a complex III inhibitor; Oli, oligomycin, a blocker of mitochondria ATPase and phosphoryl group transfer. The cells were treated with rotenone (1 µM), antimycin A (2 µM), or oligomycin (1 µg/ml) in Kreb’s buffer with 3 mM glucose for 30 min and followed by glucose stimulation (3 mM vs. 20 mM) in the same buffer system for 30 min. *, p < 0.05 compared with 3 mM glucose alone; #, p < 0.05 compared with 20 mM glucose alone.
Fig. S7. Simulation results showing pre-existing oxidative stress can suppress H2O2 signaling triggered by a subsequent stimulus. The degree of suppression is positively correlated to the stress level.
Table S1. Induction of Nrf2 downstream genes in INS-1 (832/13) cells Genes Treatments HO-1 GCLC NQO-1 GPx2 SOD2 Control 100 ± 10 100 ± 4.5 100 ± 15 100 ± 4.5 100 ± 8.0 HNE 172 ± 15* 211 ± 4.5* 181 ± 18* 131 ± 14 114 ±12 MGO 179 ± 18* 303 ± 9.0* 112 ± 16 116 ± 21 126 ± 1.7 Arsenite 276 ± 4.8* 196 ± 8.1* 210 ± 9.0* 187 ± 7.2*167 ± 12* Data shown as mean ± SEM (n = 3). *, p < 0.05 compared with control. Treatments: the cells were exposed to HNE (20 µM), MGO (0.4 mM) and arsenite (5 µM) for 6 hours.