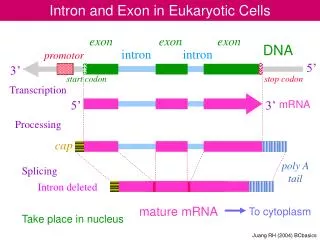
Exon 1
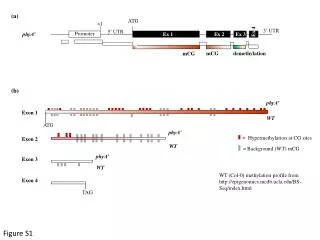
(a). ATG. +1. 3’ UTR. 5’ UTR. Ex 4. Promoter. phyA’. Ex 1. Ex 2. Ex 3. mCG. demethylation. mCG. (b). phyA’. Exon 1. WT. ATG. phyA’. = Hypermethylation at CG sites. Exon 2. WT. = Background (WT) mCG. phyA’. Exon 3. WT.

Exon 1
E N D
Presentation Transcript
(a) ATG +1 3’ UTR 5’ UTR Ex 4 Promoter phyA’ Ex 1 Ex 2 Ex 3 mCG demethylation mCG (b) phyA’ Exon 1 WT ATG phyA’ = Hypermethylation at CG sites Exon 2 WT = Background (WT) mCG phyA’ Exon 3 WT WT (Col-0) methylation profile from http://epigenomics.mcdb.ucla.edu/BS-Seq/index.html Exon 4 TAG Figure S1
(a) Ex 2 Ex 3 Promoter Ex 1 Ex 4 5’ UTR 3’ UTR # WT +phyA-sps1 # # 249 329 370 725 1421 701 617 617 1077 E E H1 H2 H4 H3 H8 H5 H6 H7 + + + Probe 3 F2 (sps1 x WT) Sps1 WT 1 2 3 4 (b) 2.3 kb 1.7 kb Probe 3 Figure S2
(a) (b) Relative transcript abundance Relative transcript abundance Relative transcript abundance Relative transcript abundance At4g19240 At5g05290 (d) (c) At1g23960 At1g03950 Figure S4