Download
1 / 13
130 likes | 260 Vues
SOURCE ATTRIBUTION OF MERCURY EXPOSURE FOR U.S. SEAFOOD CONSUMERS: IMPLICATIONS FOR POLICY. Noelle Eckley Selin Joint Program on the Science and Policy of Global Change Center for Global Change Science Massachusetts Institute of Technology

E N D
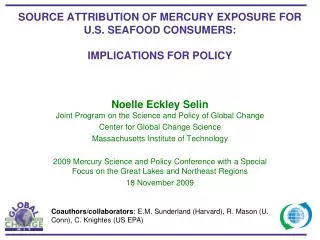
SOURCE ATTRIBUTION OF MERCURY EXPOSURE FOR U.S. SEAFOOD CONSUMERS: IMPLICATIONS FOR POLICY Noelle Eckley SelinJoint Program on the Science and Policy of Global Change Center for Global Change Science Massachusetts Institute of Technology 2009 Mercury Science and Policy Conference with a Special Focus on the Great Lakes and Northeast Regions 18 November 2009 Coauthors/collaborators:E.M. Sunderland (Harvard), R. Mason (U. Conn), C. Knightes (US EPA)
RESEARCH QUESTIONS: OUTLINE • How can we use coupled atmospheric and ecosystem models to assess the full pathway from mercury emissions to methylmercury exposure? • What are the potential future impacts of U.S. mercury emissions?
GLOBAL BIOGEOCHEMICAL CYCLE OF MERCURY [Selin et al. GBC 2008; Selin, Ann. Rev. Env. Res., 2009]
DEPOSITION PATTERNS IN THE UNITED STATES Highest Emission: Ohio River Valley Highest Deposition: Florida/Gulf Coast Why doesn’t the area of highest Hg(II) emission have the highest deposition? GEOS-Chem captures magnitude and spatial variation of measured wet deposition We can use the model to gain insights into deposition processes. [Measurements: Mercury Deposition Network; Model: Selin & Jacob, AE 2008]
SEASONAL PATTERNS OF U.S. DEPOSITION Measurements GEOS-Chem North American contribution • Amplitude of seasonal variation has latitudinal dependence • GEOS-Chem captures magnitude, amplitude of regional variation • Contributing factors: • Oxidation • Inefficient wintertime scavenging • Downwelling & convective scavenging from free troposphere [Measurements: Mercury Deposition Network; Model: Selin & Jacob, AE 2008]
NORTH AMERICAN VS. INTERNATIONAL DEPOSITION Results from GEOS-Chem global land-ocean-atmosphere Hg model [Selin et al., 2007, 2008] Up to 60% of deposition in Midwest/Northeast is from domestic sources Florida has highest deposition in the U.S., but mostly from non-US sources Policy implications: Reducing deposition in both Midwest and Southeast will require policy actions on multiple political scales (national and global) But, what about methylmercury? [Selin & Jacob, AE 2008]
FROM DEPOSITION TO FISH METHYLMERCURY [Engstrom, 2007]
9% 32% 23% 59% 11% 66% FRESHWATER DEPOSITION AND SOURCE ATTRIBUTION How do sources affect fish methylmercury, and on what timescales? Northeast U.S. Southeast U.S. International Anthropogenic 24.21 g m-2 y-1 34.08 g m-2 y-1 Pre-industrial + Historical N. American Anthropogenic SERAFM: Lake model WASP7: River model WCS (MLM): Watershed loading BASS: Aquatic food web [Knightes et al., 2009] Policy and Timescale Analysis [Selin et al., EHP, in press]
FRESHWATER TIMESCALE ANALYSIS Each ecosystem driven by present-day deposition for 40 years Policy experiment: All Hg is “historical” at t=0. How is anthropogenic signal reflected in fish, and on what timescale? Ecosystem A Fish MeHg (ppm) Same deposition,but different ecosystem dynamics lead to very different source attributions (and concentrations) over time (watershed role) Ecosystem B Note difference in scale! Regional differences in deposition sources lead to different attributions in similar ecosystems [Selin et al., EHP, in press]
LOCAL EXPOSURE FROM FRESHWATER FISH 2 x 100 g fish meals/week (60 kg person) @ t=40 y 6.4 North American anthropogenic International anthropogenic Historical+Natural WHO intake threshold EPA Reference Dose Ecosystem A Ecosystem A Ecosystem B Ecosystem B Southeast Northeast [Selin et al., EHP, in press]
POPULATION-WIDE EXPOSURE FROM MARINE FISH No mechanistic link (yet) from oceanic Hg concentration to fish methylmercury Historical exposure could continue to increase, complicating policy decision-making Different challenges on different scales (local to global) Adaptation and mitigation necessary? (Learning lessons from other issue areas) “current emissions” scenario 14-box ocean model: Sunderland and Mason, 2007 [Selin et al., EHP, in press]
Hg Session: “Pathways of Mercury Transport and Exposure at Multiple Scales”American Geophysical Union meetingDecember 17 (oral session); December 18 (posters)San Francisco, California • “A Methylmercury Prediction Too For Surface Waters Across The Contiguous United States,” D. P. Krabbenhoft • “Mercury Isotopic Evidence for Contrasting Mercury Transport Pathways to Coastal versus Open Ocean Fisheries,” J. D. Blum • “Evidence for the free troposphere as a source of atmospheric mercury measured in Reno, Nevada, U.S.A.” M. S. Gustin • “Global source-receptor relationships for mercury under present and year 2050 anthropogenic emissions scenarios,” E. S. Corbitt • “Lake Recovery Following Mercury Deposition Changes,” L. Levin • “Production and Cycling of Methylated Mercury Species in Arctic Marine Waters,” I. Lehnherr • “Observations of iodine oxide and reactive gaseous mercury at a coastal site in Pensacola, FL,” S. Coburn Co-conveners: Noelle E. Selin and Elsie M. Sunderland
Global Ocean Box Model >55°N 35°S-55°N >30°N >30-35°N >65°S 40°S-30°N Source: Sunderland and Mason, 2007 Slide: E. Sunderland