Basic Tools and Methods of Human Geographers
300 likes | 448 Vues
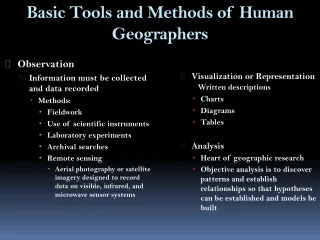
Basic Tools and Methods of Human Geographers. Observation Information must be collected and data recorded Methods: Fieldwork Use of scientific instruments Laboratory experiments Archival searches Remote sensing

Basic Tools and Methods of Human Geographers
E N D
Presentation Transcript
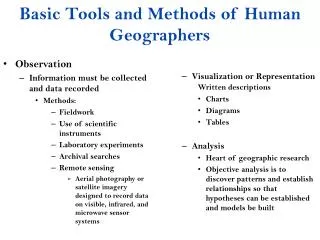
Basic Tools and Methods of Human Geographers • Observation • Information must be collected and data recorded • Methods: • Fieldwork • Use of scientific instruments • Laboratory experiments • Archival searches • Remote sensing • Aerial photography or satellite imagery designed to record data on visible, infrared, and microwave sensor systems • Visualization or Representation Written descriptions • Charts • Diagrams • Tables • Analysis • Heart of geographic research • Objective analysis is to discover patterns and establish relationships so that hypotheses can be established and models be built
Remote Sensing: acquisition of data about earth’s surface from satellite images are transmitted in digital form. • Example: used with Hurricane Katrina to monitor areas of impact
Using today’s technology • GIS: • a computer system that can capture, story, query, analyze, and display geographic data. • Primary requirement for data to be used in GIS is that the location variables are known • Any variable that can be located spatially can be fed into GIS • Data capture- putting the information into the system • Most time consuming • Farmed out to “cheap” labor countries
Layers of a GIS A geographic information system (GIS) stores information about a location in several layers. Each layer represents a different category of information.
Geographical Information Systems • GIS technology can render visible many aspects of geography there were previously unseen • Images that could never be drawn by hand • GIS can put places under the microscope, creating detailed new insights using huge databases • Military applications • Allows infantry commanders to calculate line of sight from tans and defensive emplacements • Allows cruise missiles to fly below enemy radar • GIS allows an enormous range of problems to be addressed • Geodemographic research • Uses census and commercial data about the populations of small districts in creating profiles for market research
History of the Map • 2300 B.C.E. • Babylonians • 800 B.C.E. • Turkish map ocean currents • 500 B.C.E. • 1st geography book commissioned • Important Names: • Aristotle- determined that the earth was spherical • Eratosthenes- coined the word “geography” and determined the circumference of the world
Maps • Uses • Describe data • Sources of data • Tools for analysis • Representations of the world • Usually two-dimensional graphic representations that use lines and symbols to convey information or ideas about spatial relationships
Types of Maps • Topographic Maps • Designed to represent Earth’s surface and to show permanent features such as buildings, highways, field boundaries, and political boundaries • Device for representing the form of Earth’s surface is the contour • A line that connects points of equal distance above or below a zero data point, usually sea level
Types of Maps • Reference Maps • Show common features such as boundaries, roads, and mountains • Thematic Maps • Designed to represent the spatial dimensions of particular conditions, processes, or events • Isopleth maps • Maps based on isolines • A line that connects places of equal data value • Dot maps • Single dot or other symbol represents a specified number of occurrences of some particular phenomenon or event • Choropleth map • Tonal shadings are graduated to reflect variations in numbers, frequencies, or densities
Thematic Maps • Isoline: line represents constant quantity (ex: elevation) • Proportional Symbol: size of symbol rep relative magnitude of value • Dot Map: dots show specific location of occurrences • Coropleth: uses color to rep data • Cartogram: transform country size relative to data
Map Scale: • refers to the relationship of a feature’s size on a map to its actual size on earth • Ratio between linear distance on a map and linear distance on Earth’s surface • Usually expressed in terms of corresponding lengths: • as in one centimeter equals one kilometer • or as a representative fraction • Small scale maps= bigger fraction • Large scale maps = smaller fraction
Scale Differences: Maps of Florida The effects of scale in maps of Florida. (Scales from 1:10 million to 1:10,000)
Types of Scale a. Fractional - shows the numerical ratio between distances on the map on earth’s surface *example: 1:24,000 Means 1 map unit= 24, 000 units on ground b. Written -relationship between the map and earth distances in words *example: 1 inch equals 1 mile 1st number represents map’s distance 2nd number represents earth’s distance
C. Graphic -consists of a bar line marked to show distance on the earth’s surface example: *what scale you use depends on what information you are portraying!*
Projection talking map -the scientific method of transferring locations on the earth’s surface to a flat map -earth’s surface is curved and not a perfect sphere. It is impossible to represent on a flat plane without distortion -Four problems: 1. the shape of an area can be distorted 2. the distance between two points may increase or decrease 3. the relative size of different areas may be altered so that one area may appear larger 4. the direction from one place to another can be distorted.
the Solution????? Different types of projections! -Equidistant Projections -can represent distance accurately in only one direction (usually north-south) -usually provide accurate scale in perpendicular direction( equator) -most aesthetically pleasing
Types of Projections: • Mercator: preserves direction but distorts area (higher latitudes distorted - Greenland appears huge). Also known as Conformal • Fuller: maintains accurate size and shape; completely rearranges direction • Robinson: distorts all 4 but minimizes errors in each (most balanced) • Azimuthal: puts N or S pole at center of map…view of looking up or down at earth
Projections • Azimuthal • Designed such that compass directions are correct only from one central point • Benefits: • Can be equidistant • Direction is accurate • Uses: • Show air-route distances from a specific location • Or equal-area
Projections • Equal-Area or Equivalent projections (Gall-Peters Projection) • Portray areas on Earth’s surface in their true proportions (scale will be off –only true on parallels and PM) • Examples: • Eckert IV • Bartholomew’s Nordic • Mollweide • Used for thematic maps showing economic, demographic, and cultural data • Aesthetic maps • More important than conformality, equivilance, or equidistance • Examples: • Times Projection • Used in many world atlases • Robinson Projection • Used in National Geographic publications
Robinson Projection: -shows uninterrupted projections -useful for displaying the oceans
Projections • Peters • Deliberate attempt to give prominence to underdeveloped countries of equatorial regions and the Southern Hemisphere • Adopted by United Nations • Shape gives “shock value” • Cartogram • Usually small-scale thematic maps • Space is transformed according to statistical factors • Largest mapping units represent greatest statistical values