Download
1 / 32
320 likes | 427 Vues
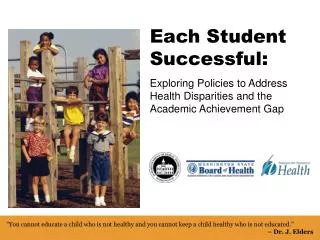
Each Student Successful: Exploring Policies to Address Health Disparities and the Academic Achievement Gap. “You cannot educate a child who is not healthy and you cannot keep a child healthy who is not educated.” – Dr. J. Elders. Session Objectives.

E N D
Each StudentSuccessful: Exploring Policies to AddressHealth Disparities and theAcademic Achievement Gap “You cannot educate a child who is not healthy and you cannot keep a child healthy who is not educated.” – Dr. J. Elders
Session Objectives • Discover the relationship between health and learning for those students impacted by both health disparities and the academic achievement gap. • Discuss the applicability of policy and program approaches that address the needs of the whole child.
Why it is important: You cannot educate a child who is not healthy and you cannot keep a child healthy who is not educated. – Dr. J. Elders
What we know: • “The one social factor that researchers agree is consistently linked to longer lives in every country where it has been studied is education. It is more important than race; it obliterates any effects of income.” — New York Times • “Culturally appropriate school programs that address risk behaviors among youth, especially when coordinated with community efforts, could improve the health of populations at risk for health disparities, and the health of the nation as a whole.” — Centers for Disease Control & Prevention
A Summit to Consider… • Which students are disproportionately affected by the academic achievement gap and health disparities--and why. • What we know about programs and policies that can positively impact both health and learning. • What strategies and partners are needed to work on closing these gaps. • What messages are needed to help us reach a common understanding of the issues and solutions.
Redd, Z., Brooks, J., McGarvey, A.M. (2002). Educating America’s youth: What makes a difference. Downloaded from: www.childtrends.org Hanson, T.L., Austin, G., Lee-Boyha, J. (2004). How are student health risks and resilience related to the academic progress of schools? Downloaded from: www.wested.org McNeely, C. (2002). The untapped power of schools to improve the health of teens. The State Education Standard, Autumn 2002, 18-23.
Measuring Academic Achievement • The achievement gap is narrowing in reading and writing for all ethnic groups • The achievement gap is not narrowing in math • Graduation rates continue to reflect the achievement gap • Washington Assessment of Student Learning (WASL) • Graduation Rates
Low-income students: 18,677 16.5% of 3/3 31.5% 45.2% 56.9% 2006 WASL: All students 10th-grade students meeting standard in one or more subject areas 60.0 55.0 52.1 50.0 Total students, Class of ’08: 68,476 45.0 40.0 35.0 30.0 28.8 25.0 20.0 15.0 10.8 10.0 8.3 5.0 0.0 Met 3/3 Met 2/3 Met 1/3 Met 0/3
2006 WASL: Hispanic students 10th-grade students meeting standard in one or more subject areas 60.0 55.0 50.0 Total Hispanic students, Class of ’08 : 6,608 45.0 Low-income Hispanic students: 4,477 40.0 35.0 32.4 30.0 26.9 25.0 21.9 20.0 18.9 15.0 66.9% 10.0 84.2% 50.2% of 3/3 75.1% 5.0 0.0 Met 3/3 Met 2/3 Met 1/3 Met 0/3
2006 WASL: Black students 10th-grade students meeting standard in one or more subject areas 60.0 Total Black students, Class of ’08 : 2,959 55.0 Low-income students: 1,422 50.0 45.0 40.0 39.7 35.0 30.0 25.5 25.0 20.0 17.6 17.1 15.0 10.0 44.5% 35.8% of 3/3 63.5% 58.7% 5.0 0.0 Met 3/3 Met 2/3 Met 1/3 Met 0/3
2006 WASL: White students 10th-grade students meeting standard in one or more subject areas 60.0 56.9 55.0 50.0 Total white students, Class of ’08 : 50,742 45.0 Low-income students: 10,299 40.0 35.0 30.0 27.9 25.0 20.0 15.0 10.0 9.2 6.0 13.2% of 3/3 5.0 24.4% 36.4% 43.5% 0.0 Met 3/3 Met 2/3 Met 1/3 Met 0/3
Some students are leaving school less prepared to succeed than others
Academic Achievement and Health • Recent data from Washington’s Healthy Youth Survey describing youth health risks • Associations between health risks and academic risks • Highlights for youth of color
How does this relationship between health & academics work? Health Risk Academic Risk RACE/ Ethnicity Individual Factors Peer Factors Family Factors Community Factors
Washington State Healthy Youth Survey • School-based youth behavior survey • 6th, 8th, 10th and 12th graders • Given in fall of even-numbered years • Fall 2006 participation: • Almost 200,000 students • More than 1,000 schools • All 39 Washington counties • Interactive website: www3.doh.wa.gov/hys
Healthy Youth Survey Analysis • Academic Risk • Students reporting they get mostly Cs, Ds, or Fs • Health Risk • Behaviors/conditions that may lead to disease • Race/Ethnicity • “How do you describe yourself?”- multiple responses allowed • Hispanic/Latino is asked in combination with race * indicates significantly “worse” ** indicates significantly “better”
In comparison to non-Hispanic white youth, academic risk is about double for Native American and Black youth, about 40% greater among Hispanic and Pacific Islander youth, and 50% lower among Asian youth. Source: 2006 Healthy Youth Survey, state sample only grades 8-10-12 combined. Graph uses unadjusted estimates; relative risk ratios are for estimates adjusted for grade (8-10-12), maternal education (3-level), gender.
Health/Safety Risks Associated with Academic Achievement Many highly prevalent health risks found to contribute independently to academic risk • Overweight • Exercise • Cigarette smoking • Feeling safe at school • Depression • Soda pop consumption • Severe persistent asthma • Alcohol and marijuana use
A Few Considerations in Planning Health Disparity/Academic Achievement Gap Interventions • Within race/ethnic groups (esp. “Asian/Pacific Islander” grouping), youth can be quite different from each other with regard to risks • Interventions planned to address health disparities among students of color need to be culturally competent
Impacting Health and Learning: Some programs and policies to consider • Universal breakfast programs • Coordinated school health • School based health centers • Lifeskills Health Education • Youth Development • Discipline policies • Focus on learning, not just test scores
Programs and Policies that Have Proven Effective An Example: School Connectedness (n.) The belief by students that adults and peers in the school care about their learning as well as about them as individuals.
Adolescents who feel connected to school have better academic outcomes… • Better school attendance • Higher academic performance • Higher school completion rates
…and better health outcomes Adolescents who feel connected to school are less likely to • Exhibit disruptive or violent behavior • Carry or use a weapon • Engage in early-age sexual intercourse • Consider or attempt suicide • Experiment with illegal substances or drink to the point of getting drunk • Smoke cigarettes • Be emotionally distressed
Policies to Encourage Connectedness • Discipline Policies • Zero Tolerance negatively impacts connectedness • Inconsistent/inequitable enforcement negatively impacts connectedness • Opportunities for Students to Form Diverse Friendship Groups • Variety of extra-curricular activities • “Mix-It-Up” lunches • Analyzing school policies for consequence of segregating (tracking, busing, etc.)
State Policy Impacting School Health Policy SB 5093-Cover All Kids Bill • Goals for 2010… • All school districts to have School Health Advisory Councils • All schools to meet defined nutrition standards • Ensure that PE staff are certified and minute requirements are met
Programs and Policies that Have Proven Effective-Coordinated School Health
Opportunities for Involvement in Coordinated School Health • Activate youth in Coordinated School Health promotion and Wellness Committees • Washington Health Foundation Healthiest State in the Nation and Health Bowl School Recognition (www.whf.org) • Educate local administrators with resources from www.healthyschoolswa.org
Discussion-Sharing Our Experiences and Successes • How have you used local health data? • Have you implemented policies and/or programs to address both health and learning? • Have you implemented these specifically to meet the needs of students of color? • Have you articulated a framework or direction for addressing the needs of the whole child?
Summary • Health and education are linked • Health disparities and the educational achievement gap are linked • Strategies to address health disparities and the educational achievement gap include: • Collaborate across sectors • Implement a coordinated approach to school health • Address root causes such as school connectedness
Challenge to Health & Education • Balance our traditional roles with innovative community based approaches. • Agree on a frame work for policy change. • Have one voice. • Dr. Maxine Hayes; Each Student Successful Keynote