Download
1 / 51
510 likes | 621 Vues
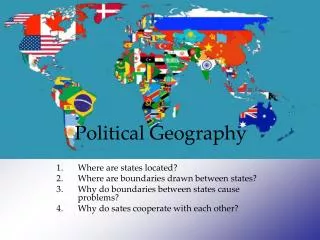
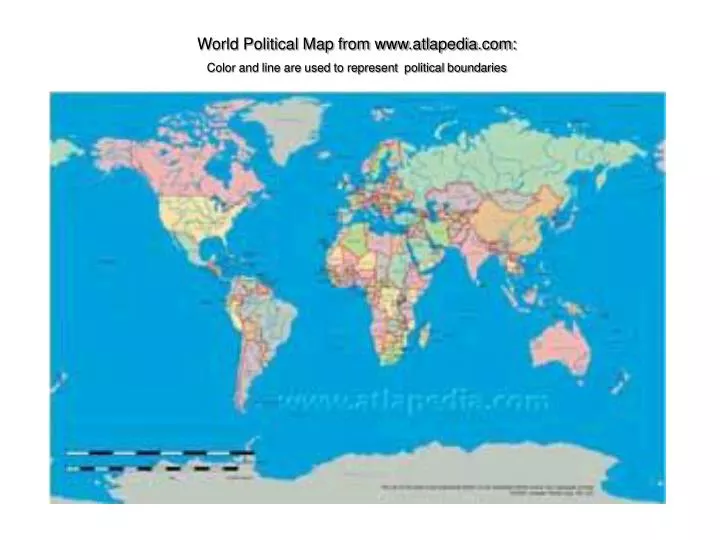
World Political Map from www.atlapedia.com: Color and line are used to represent political boundaries. Physical Map from www.atlapedia.com: 3D contour and color indicates major landforms. Historical Climate Map: Showing bodies of water and ice forms. Antique Population Distribution Map:

E N D
World Political Map from www.atlapedia.com: Color and line are used to represent political boundaries
PhysicalMap from www.atlapedia.com: 3Dcontour and color indicates major landforms
HistoricalClimateMap: Showing bodies of water and ice forms.
Antique PopulationDistributionMap: State and County boundaries drawn in and color coded by population range.
TopographicalMap: Contour lines indicate changes in elevation
KeyforMapofaFictionalPlace: From a Tony Hillerman detective novel that takes place in the Southwest.
SimultaneousSubjectTimeline: This format allows the viewer to scan all of the major world leaders over time.
Mappinga Project Plan: This schematic represents work flow and a timeline of events for a video game design team
MapsofOrganizationalStructure:This map shows the overlap of function of divisions within an organization.
WebsiteMaps:This diagram maps the website for the Ndebele Project, showing relationships among and means for navigating the areas of the site.
AssociationMapping: This map shows conceptual relationships based on the color blue.
Child’sConceptMap: This map functions like an outline, from predominate associations to sub-associations.
MappingCauseandEffect: This schema shows the outcome of various actions on the environment, from the California Department of Natural Resources.
CharacterMappinginLiterature: A graphic means of identifying characteristics and examples from literature.
MiddleSchoolConceptMap: Show categories and subcategories of knowledge on a subject.
StoryMapforKids: Mapping the flow of events over time in a narrative
This story started out in a farm. The kids were on their summer vacation. Having a very fun time. Until one day they found a U.F.O in the back yard! The door opened they never knew what to do because they were alone in the darkness. They saw a martian step out of it. They were about to run. But the alien said I will not hurt you. So then they went to space. Then they went to Andromeda. Then they went home.
Child’s Story Map: This one shows how important objects in the story helped move the narrative along.
Narrative Map of the ThreeLittlePigs: Illustrations, writing and arrows map the chain of events in the story.
www.thestoryboardartist.com: TV Storyboard Sample Page: Rubber Ducky: This spot was for Homeruns.com. The voice over at the end asks, "What would you do today if you didn't have to go to the store?"
Saul Steinberg's most famous composition, A View of the World from Ninth Avenue:This is a bird's-eye view of NYC fromNinth Avenue in a straight line westward,with space becoming ever more condensed.
From: Codex Espangliensis, by Guillermo Gomez Pena, Enrique Chagoya, and Felicia RiceThe interaction and class of times & cultures through mythological symbols and pop icons. The text reinvents history (an Aztec sailor named Europzin discovers a New World and names it Europe).
From: Acme Novelty Library, by Chris Ware:An image of a man’s childhood home provides the space in which to map various memories.
From Acme Novelty Library, by Chris Ware:Ware uses interconnected panels to trace the significance of an object in a drawer.
From: The Flight Into Egypt, by Timothy ElyEly uses cryptic symbols and glyphs over painted maps to explore the sixteen mysterious weeks his father spent in Egypt.
From: Biological Ultrastructure, ed. By Patricia HarrisThis is just a real amusing model of photosynthesis. You might map your life or yourself as a machine of some kind
Taken from: The Visual Representation of Quantitative InformationImagine different aspects of your life and experiences represented on such a graph.
Taken from: The Visual Representation of Quantitative InformationImagine different aspects of your life and experiences represented on such a graph.
Taken from: The Visual Representation of Quantitative InformationImagine different aspects of your life and experiences represented on such a graph.
From Acme Novelty Library, by Chris Ware:a single event extrapolated over the space of the page
From: Imagining Language, edited by Jed Rasula and Steve McCaffery:text and image arranged to form a larger symbolic structure
Personal Map using the body as a canvas, with reference points marking significant events in her life.
A Personal Map based on the cars the artist owned, with photos of the cars on one side and maps and writing of significant events that happened in and with the car on the other.
A Personal Map with a collage of important images for the phases of the artist’s life, and a painted wooden box with differently shaped cards inside. Each card is a different shape based on multiple personal identities.
A Personal Map based on the artist’s best friends and the emotions and events that they represent to her indicated with color and figure.
Personal Map done on transparent layers--the bottom layer is a literal geographic map with historic and personal events written over the areas where thye o0ccurred. A key on the right margin helps the viewer understand his codes and symbols.