Download
1 / 23
240 likes | 343 Vues
Satellite Measurements of Volcanic SO 2 Emissions into the UTLS. Simon A. Carn 1 , Kai Yang 2,3 , Nickolay A. Krotkov 3 , and Fred J. Prata 4 Michigan Technological University, Houghton, MI, USA University of Maryland, College Park, MD, USA

E N D
Satellite Measurements of Volcanic SO2 Emissions into the UTLS • Simon A. Carn1, Kai Yang2,3, Nickolay A. Krotkov3, and Fred J. Prata4 • Michigan Technological University, Houghton, MI, USA • University of Maryland, College Park, MD, USA • Laboratory for Atmospheres, NASA Goddard Space Flight Center, Greenbelt, MD, USA • Norwegian Institute for Air Research, Kjeller, Norway
More Reflected Solar Flux Less Upward IR Flux Stratospheric aerosols (Lifetime ≈ 1-3 years) backscatter absorption(near IR) Solar Heating emission H2S SO2 IR Heating ® H2SO4 NET HEATING IR Cooling Heterogeneous® Less O3 depletionSolar Heating HCl, BrO, ClO emission absorption (IR) Explosive forward scatter CO2 H2O Enhanced Diffuse Flux Effusive Effects on cirrus clouds Gas scavenging? Ashfall Reduced Direct Flux More Downward IR Flux Less Total Solar Flux NET COOLING Exsolution Dissolved volatiles STRATOSPHERE Tropopause (8-17 km) TROPOSPHERE Indirect Effects on Clouds SO2® H2SO4 Passive Tropospheric aerosols (Lifetime ≈ 1-3 weeks) Effects of volcanic emissions on the climate system Original slide courtesy of A. Robock
UV satellite remote sensing of volcanic SO2 SW Pacific April 23, 2006 2004- Ozone Monitoring Instrument (OMI) 1978-2005 Total Ozone Mapping Spectrometer (TOMS) 2012- Suomi NPP/OMPS
UV satellite volcanic SO2 emissions inventory (1978 – 2013) [Bluth et al., 1993; Carn et al., 2003] Pinatubo El Chichòn Nabro • Increase in total explosive volcanic SO2 emissions from 1997-2011
Increase in tropical stratospheric AOD since 2000 Pinatubo Hofmann et al., GRL, 2009 Ruiz Increase linked to influence of tropical volcanic eruptions Vernier et al., GRL, 2011 Solomon et al., Science, 2011
UV satellite volcanic SO2 emissions inventory (1978 – 2013) [Bluth et al., 1993; Carn et al., 2003] El Chichon Pinatubo Nabro TROPICS
Aura (2004-) CloudSat (2006-) Aqua (2002-) OMI - SO2, NO2, BrO TES - SO2 MLS - strat. SO2, HCl CPR (radar)– precipitation, hydrometeors MODIS- SO2, ash, sulfate AIRS - UTLS SO2, ash The A-Train CALIPSO (2006-) CALIOP (lidar)- cloud altitude, aerosol phase
2006 MLS HCl MLS SO2 Nyamulagira Rabaul Soufriere Hills OMI SO2
2008 MLS HCl MLS SO2 Kasatochi Okmok OMI SO2
2009 MLS HCl MLS SO2 Sarychev Peak Redoubt OMI SO2
2011 MLS HCl MLS SO2 Cordon Caulle Nabro Grimsvötn Nyamulagira OMI SO2
2012 MLS SO2 Paluweh Popocatepetl? 2013
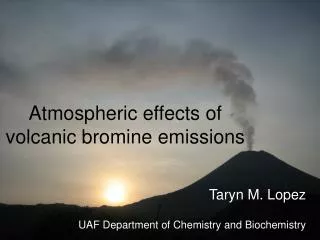
Grimsvötnmammatus (May 2011) Photos by JónÓlafur • Fate of volcanic gases in eruption columns • Gas scavenging on ash and hydrometeors
Sulfur budget of the Grimsvötn 2011 eruption MetOp/IASI – H2S May 22 May 23 OMI - May 22 ~29 kt H2S May 24 L. Clarisse – LATMOS/ULB • H2S/SO2 = ~0.1, similar to in-situ Icelandic gas samples • ~15 kt S2? • ~120 kt S sequestered on ash • 0.6 Tg SO2 emitted; only 0.3 Tg reached UTLS • 38% S scavenged cf. 20% [Textor et al., 2003] ~0.3 Tg SO2 Sigmarsson et al., GRL, in review
Suomi-NPP/OMPS UV Sensors Limb instrument: Aerosol and Ozone profiles above tropopause NP Nadir Mapper (NM): swath similar to OMI
Suomi NPP/OMPS NM SO2 data for Paluweh (Indonesia) Feb 4, 2013 Feb 5, 2013 Paluweh HYSPLIT forward trajectory @ 17 km HYSPLIT forward trajectory @ 15 km • Reported (ash) plume altitude = ~14 km
Suomi NPP/OMPS NM data for Paluweh CALIPSO Vertical Feature Mask Stratospheric aerosol detection
Aura/OMI data for Paluweh CALIPSO Vertical Feature Mask Stratospheric aerosol detection • ~0.03 Tg SO2 -> 0.04 Tg H2SO4 • Only 0.01-0.02 Tg/S year required to explain post-2002 strat. AOD increase [Hoffman et al., 2009]
Direct retrieval of SO2 altitude from UV radiances • SO2 altitude directly retrieved from UV radiances • Validate with CALIPSO, MLS • Reprocessing of entire UV OMI-OMPS data archive planned (NASA MEaSUREs project) • SO2 altitude retrievals for 2008 Kasatochi eruption [Yang et al., JGR, 2010]
Summary • Long-term record of volcanic SO2 emissions based on UV satellite measurements continues (TOMS, OMI, OMPS) • Increased SO2 flux from explosive volcanism 1997-2011 • Consistent with observed stratospheric AOD trends • Less explosive volcanism in 2012-13 • A-Train data (MLS, CALIPSO) provides profile information • New insights into sulfur gas scavenging in eruption columns • 2011 Grimsvötn (Iceland) eruption: 50% of S scavenged • Many small tropical eruptions inject SO2 to tropopause level • SO2 sufficient to sustain long-term increase in stratospheric AOD • Plume altitudes based on ash clouds may underestimate SO2 altitude • Direct UV SO2 altitude retrievals now available • Reprocessing of all major eruptions planned to develop new altitude-resolved volcanic SO2 climatology (NASA MEaSUREs) • Acknowledgments: NASA funding (Aura Science Team, Atmospheric Chemistry Modeling and Analysis program, NPP Science Team, MEaSUREs)
Time-series of maximum MLS SO2 and HCl HCl 40 25 Direct injection 68 hPa 46 hPa Monsoon SO2 10 15
OMI SO2 zonal means Noise Noise Noise Noise Grimsvötn Okmok Kasatochi Nabro 2011 2008 Noise Noise • Nabro was the largest tropical volcanic SO2 emission since the 1991 Pinatubo eruption Sarychev 2009