Download
1 / 38
400 likes | 622 Vues
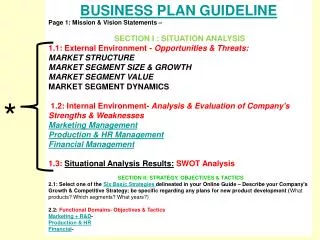
BUSINESS PLAN GUIDELINE Page 1: Mission & Vision Statements – SECTION I : SITUATION ANALYSIS 1.1: External Environment - Opportunities & Threats: MARKET STRUCTURE MARKET SEGMENT SIZE & GROWTH MARKET SEGMENT VALUE MARKET SEGMENT DYNAMICS

E N D
BUSINESS PLAN GUIDELINE Page 1: Mission & Vision Statements – SECTION I : SITUATION ANALYSIS 1.1: External Environment - Opportunities & Threats: MARKET STRUCTURE MARKET SEGMENT SIZE & GROWTH MARKET SEGMENT VALUE MARKET SEGMENT DYNAMICS 1.2: Internal Environment- Analysis & Evaluation of Company's Strengths & Weaknesses Marketing Management Production & HR Management Financial Management 1.3: Situational Analysis Results: SWOT Analysis SECTION II: STRATEGY, OBJECTIVES & TACTICS 2.1: Select one of the Six Basic Strategiesdelineated in your Online Guide – Describe your Company's Growth & Competitive Strategy; be specific regarding any plans for new product development (What products? Which segments? What years?) 2.2: Functional Domains- Objectives & Tactics Marketing + R&D- Production & HR Financial- *
EXTERNAL Macro- Environment UNCONTROLLABLE INTERNALEnvironment CONTROLLABLE Economic Social Corp./Business STRATEGY Competitive Demographic Psychographic trends Finance Forces Marketing/R&D Technological Political Production/HR Legal Regulatory
Next Big Q How good are you in making your goods…
1)Assess your Production Efficiencies- Plant Utilization & Automation: 2)Assess your Company's HR & Labor Force Productivity: 3)Assess cost of changing capacity & levels of automation of each of your production lines:
ROW#1 FAIR SHARE ESTIMATES: 3-4 Rnds out:
A Historical Consideration…RE: Projected Share • LOW END: 0-1 product killed.. 0-1 repositioned or introduced • TRADITIONAL: 3-6 repositioned from High…0-1 killed…1-2 introduced • SIZE: 0-1 killed, 0-1 repositioned to Traditional, 1-2 introduced • PERFORMANCE: 1-2 killed, 0-1 repositioned to Traditional, 0-1 introduced • HIGH: 1-3 killed or repositioned to Traditional, 1-3 new products arrive in rounds 2 or 3
Round 3- ForecastSegment Competitive Density • LOW END: 6 products=rivalry unchanged • TRADITIONAL: 9 products, w/ 3 repositioned= increased competition • SIZE: 7 products, w/ 2 new= increased competition • PERFORMANCE: 4 products, w/ 1 new= reduced competition • HIGH: 6 products, w/ 2new= increased competition 6 4 9 6 7
-Given Round 3 Scenario-How should adjust your production capacities?
Utilize 2nd Shift? ROW#3
Why run 2nd shift –when labor costs 50% higher? Answer by using your proformas: 1- On production spreadsheet build at capacity- if have 1000 units – build 1000 units 2-On Marketing display- FORECAST 1000 UNITS 3.-ON Proforma Income statement- note NET MARGIN – THE BIQ Q: If we double sales will we double our net margin?– Will we make less because labor costs are 50% higher for 2nd shift?
Why run 2nd shift –when labor costs 50% higher? Answer by using your proformas: 1- On production spreadsheet double output-run full 2nd shift 2-On Marketing display- double forecast 3.-ON Proforma Income statement- NET MARGIN –will more than double THE BIQ A: When run 1 shift- must pay all fixed costs- 2nd shift gets a free ride-only has to pay labor premium…
Quick N’ Dirty • Consumer Pref’s • Best vs. Worst Case Projections
Estimate Your EARNED SHARE: • 2 Q’s: • What will the average product sell in the segment next round? • To what degree is your product above or below average-on consumers'’ buying criteria?
EARNED Share - Sales Forecast Look-up next round Industry Demand … Estimate# products that will be in segment. Divide total industry demand by the number of products= FAIR SHARE Your product’s EARNED demand can be ½ to 2X the average product’s demand… Compare your product with competing products. Factors include design, awareness, accessibility, and planned mid-year revisions. Examine industry capacities & capacities of the “best” products. Can products meet the demand they generate?
Quick N’ Dirty • Consumer Pref’s • Best vs. Worst Case Projections
R#2 2 1
For Example-in Traditional segment everyone begins w/ 13% market share • Opening rounds crucial- can establish competitive advantage (that can be sustained for many years- even thru-out entire sim.) • Initial round demand can vary +/- 25% • Later rounds best case/worst case vary ~~~~ 10-15%
After 1st Year/Round-Can see demand spread R#2 R#3 R#1
CASE CASE
Worst Case: • BIG INVENTORY- Little Ca$h • Best Case: • Lots of CA$H - Little Inventory
Enter WORSE case- in “your sales forecast” on marketing spreadsheet • Enter BEST case- in “production schedule” on production spreadsheet • Spread show up as inventory on proforma BALANCE SHEET
$0.00 In WORSE CASE: You have lots of Inventory & little or no Cash. need to drive cash position to the black…
To adjust your cash position -- • If you are cash poor, issue Stock /Bonds - or consider a short term loan • If you are cash rich, pay dividends and/or buy back stock.
Important Considerationsre: BEST-WORST Scenario Analyses By adjustingyour CASH POSITIONaccording to your WORST CASE estimate– will avoid … BiG AL
Important Considerationsre: BEST-WORST Scenario Analyses By adjustingproduction according to BEST CASE estimate– will minimize loss of profit due to Stock-outs • Fixed costs(marketing, R&D, interest or depreciation)already covered • Thus, any additional sales would only incur variable(production) costs
For example: If annual sales $120M, = $10M/mo. If a months material & labor costs = $7M, you missed contributing $3M to Net Margin. You’r taxed at ~35%, so your opportunity cost is ~$2M in profit.
How Big is your Slinky? • Worst Case: • BIG INVENTORY/ no cash– risk seeing Big Al • Best case: • Lots of CASH / noInventory -you risk stockout
Determining A Reasonable Spread • Want to avoid generating an ultra Conservative Worst case scenario …matched w/ an ultra Optimistic Best case scenario • Should be able to sell excess inventory • in ~betw. 6 & 16 weeks
How to measure your slinky slack-- Take your total inventory costs $23,900M
& Divide by total variable costs of inventory sold: $23,900M/$131,119M =.18 52weeks *.18 = 9 Risk ~9weeks of Inventory to avoid stockout
Tutorials: Forecasting & Developing a Unit Sales Forecast • Guidelines Re: Sales Forecasting