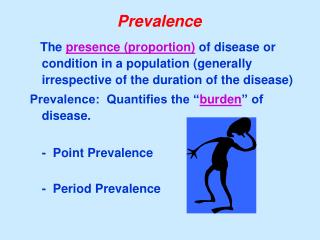
Understanding Epidemiologic Prevalence Modeling for Public Health Improvement
140 likes | 265 Vues
This project, led by Michael Soljak and the Healthy Choices Implementation Team, explores the significance of epidemiologic prevalence modeling in informing public health strategies. It assesses disease register completeness, compares health outcomes, and aids in health care planning and commissioning. Examples include the PBS diabetes model that estimates diabetes prevalence and the HPA HIV prevalence model using Bayesian methods. The project aims to enhance service provision, equity audits, and future demand projections in health and social care based on varied population characteristics and trends.

Understanding Epidemiologic Prevalence Modeling for Public Health Improvement
E N D
Presentation Transcript
Epidemiologic Prevalence Modelling Project Michael Soljak Informing Healthy Choices ImplementationTeam Julian Flowers Eastern Region PHO
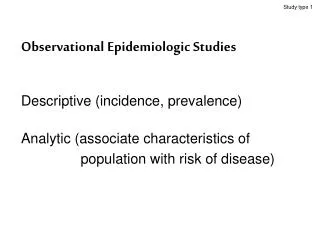
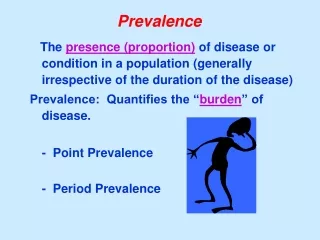
Why Model Prevalences? Epidemiologic disease and risk factor prevalence models can be used for: • assessing the completeness of disease registers in primary care or assessing the completeness of case finding • comparing outcomes such as complication rates or admission rates after adjustment for variation in expected prevalence • comparing service provision with population need • Planning and commissioning health & social care services, including projecting future levels of demand • undertaking health equity audits
Existing examples: PBS diabetes modelhttp://www.yhpho.org.uk/PBS_diabetes.aspx#1 • a spreadsheet model that generates expected total numbers of persons with Type 1 and Type 2 diabetes mellitus (diagnosed plus undiagnosed combined) in 2001 for England, GO Regions, SHAs, LAs, PCTs, electoral wards and user-defined populations including GP practices • applies age/sex/ethnic group-specific estimates of diabetes prevalence rates, derived from epidemiological population studies, to 2001 Census resident populations • forecasts of 2010 diabetes prevalence are also presented for sub-national areas based on projected population change and trends in obesity: • Scenario 1 population change only, holding 2001 BMI pattern constant • Scenario 2 population change and predicted BMI in 2010 if trends in obesity prevalence continue • Scenario 3 Population change and a return to 1995 BMI patterns
Existing examples: PBS diabetes modelhttp://www.yhpho.org.uk/PBS_diabetes.aspx#1 See also: forecasting the burden of diabetes on secondary care http://www.nwph.net/nwpho/Publications/AintreeDiabetes.pdf
Existing examples: PBS diabetes modelhttp://www.yhpho.org.uk/PBS_diabetes.aspx#1
HPA HIV Prevalence Modelhttp://www.hpa.org.uk/infections/topics_az/hiv_and_sti/publications/publications.htm • Direct method= categorising the population into a set of mutually exclusive risk groups of known size, and applying estimates of risk group-specific HIV prevalence to each group • Model was based on Bayesian multi-parameter evidence synthesis (MPES) of surveillance data • Uses WinBUGS package for Bayesian Markov chain Monte Carlo to incoporate multiple evidence sources • estimates the risk group size, group-specific HIV prevalence and proportion diagnosed in 13 risk groups, in each of 3 regions (Inner London, Outer London, Rest of England and Wales)
UK estimates of prevalent HIV infections – adults aged 15-59, 2005 Multi-parameter Evidence Synthesis method - Goubar A et al. 2005, SOPHID, Health Protection Scotland, Natsal 2000, Unlinked Anonymous Programme, National Study of HIV in Pregnancy & Childhood, ICH.
COPD Prevalence Model: PCT examplehttp://tools.erpho.org.uk/copdsel.aspx • Based on data from 2001 Health Survey for England • Logistic regression analysis used to choose risk factors for inclusion based on the strength of association between selected risk factors and COPD • Risk factors are age, sex, smoking and ethnicity, degrees of urbanisation and deprivation • Validated against a direct model obtained from epidemiologic studies • 7-fold variation in the prevalence across subgroups of the population, with lowest values in Asian women from wealthy rural areas (1.7 %), and highest in black men from deprived urban areas (12.5 %)
COPD Prevalence Model: PCT examplehttp://tools.erpho.org.uk/copdsel.aspx
APHO CHD & hypertension modelshttp://www.apho.org.uk/apho/models.aspx • Hypertension: April 2006 PCT registered populations multiplied by hypertension prevalence rates identified in the 2003 and 2004 HSfE, modified by ethnic-group age-standardised risk ratios from the 2004 HSfE • CHD: stage 1- prevalence of doctor diagnosed CHD in each age/sex stratum based on national data from the HSfE; stage 2- assumes that areas with higher CHD mortality rates have comparably higher prevalence with a linear relationship CHD SMR = (2.604 × UV67) + 25.97. Using UV67 scores calculated for each PCT, get a multiplying factor for each PCT • Both models need validation and further development e.g. effect of diabetes prevalence on CHD prevalence • NB NatCen obesity prevalence modelling to 2010, by GOR
O:E CHD Prevalence, English PCTs Benchmarking tool developed by Paul Fryers, Doncaster PCT
Projecting Older People Population Information System (POPPI) http://www.poppi.org.uk/ • will support Joint Strategic Needs Assessment • includes LA population projections to 2025 • includes data on prevalence of depression, dementia, heart attack, stroke, bronchitis\emphysema, falls, continence, visual impairment, mobility, obesity • Forecasts are provided for numbers: • Helped to live at home • Intensive home care • Community based services • Supported residents in care homes • Admissions to permanent residential and nursing care • Carers receiving services
2007-8 Work Programme • Update/improve/validate existing models and methodology • Consider development of case-finding strategies • Develop new models for a cancer site (with ACR), chronic kidney disease, and (serious?) mental illness (with NIMHE/CSIP) • Further develop intervention modelling- ASSET stroke model, health inequalities intervention model, overall mortality? • With stakeholders e.g. academia, encourage a consensus view about methodology and future requirements