Download
1 / 185
1.87k likes | 2.07k Vues
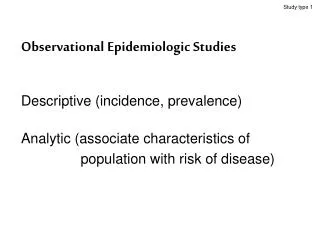
Study type 1. Observational Epidemiologic Studies Descriptive (incidence, prevalence) Analytic (associate characteristics of population with risk of disease). Study type 2. Epidemiology - Design and Bias Evaluation Spring 2005. Reference: Szklo M and Nieto FJ. Epidemiology – Beyond the

E N D
Study type 1 Observational Epidemiologic Studies Descriptive (incidence, prevalence) Analytic (associate characteristics of population with risk of disease)
Study type 2 Epidemiology - Design and Bias Evaluation Spring 2005 • Reference: • Szklo M and Nieto FJ. Epidemiology – Beyond the • Basics. Aspen Publishers, Maryland 2000. • 2. Rothman K and Greenland S. Modern Epidemiology. • Lippincott-Rven Publishers, Philadelphia, 1998. • 3. Rothman K. Epidemiology – An Introdution. Oxford • University Press, New York, 2002. • 4. Kelsey JL, Whittemore AS, Evans, and Thompson • WD. Methods in Observational Epidemiology. Oxford • University Press, New York, 1996 • 5. Kleinbaum DG, Kupper LL, and Morgenstern H. • Epidemiologic Research. Van Nostrand Reinhold, • New York. 1982.
Study type 3 Types of Observational studies A. Ecologic B. Cross-sectional C. Cohort 1. Prospective cohort 2. Retrospective (non-concurrent) cohort D. Proportional mortality studies E. Case-control
Study type 4 Variants of the case-control design Case-based case-control Case-cohort Case-crossover
Study type 5 • Steps in epidemiologic research • Define questions/hypothesis based on present • states of knowledge. • 2. Choose appropriate study design. • 3. Define groups for comparison • (e.g., cases vs. controls, exposed vs. • nonexposed). • 4. Define exposure variable(s), outcome • variables, and measure of its frequency, and • primary measure of association.
Study type 6 (continue) 5. Define extraneous variables to be measured. 6. Develop or choose measurement instruments that are valid and reliable. 7. Determine sample size. 8. Develop protocol, staff training . 9. Recruit subjects, collect data, quality control procedures. 10. Process data.
Study type 7 (continue) 11. Analyze data. A. Determine if valid statistical association exists. 1. Rule out chance. 2. Rule out bias. B. Determine if there are effect-modifiers of the association. C. Judge if association is causal 12. Discuss practical significance of findings.
Study type 8 Studies making observations on groups of individuals vs. individuals • Studies using group level data are usually called ecological studies • Two main points about ecological studies • Weak design for identifying cause and effect associations because of ecological fallacy • In some study situations group-level measures may actually provide better inference than individual-level measures
Study type 9 Example from Szklo and Nieto of grouped data from cohorts in the Seven Countries Study
Study type 10 Ecological Fallacy • Cannot tell whether the predictor and the outcome are related at the individual level • In this example: cannot tell whether the individuals in the cohorts eating less saturated fat are the individuals who are experiencing a higher rate of heart disease • Sometimes called confounding at the group level
Study type 11 Confounding in group data • If no ecological fallacy, still left with possible confounding: some third variable really causing the increase in risk • Difficult to control for because measures may not be available • Even if data available, don’t know relationship of confounding variable to other two variables at individual level
Study type 13 Advantages of group data/ecological studies • Inexpensive: secondary data already • collected (vital statistics, disease registries, • HMO’s, etc)
Study type 14 (continue) • 2. Rapid test of hypothesis: • a. Idea that ecological studies are • hypothesis-generating doesn’t reflect • their usual purpose • b. If hypothesized risk factor is associated • with disease, it may well be seen in • group level data
Study type 15 (continue) • 3. Can overcome “threshold” problem: • exposure is so universal that effect is • difficult to detect in one setting
Study type 16 (continue) • 4. Some disease transmission dynamics • can only be studied at group level • (eg, herd immunity and infectious • disease transmission) • Allows global measures of group • characteristics (e.g., type of health • care system) • Allows tests of area-level interventions • (eg, closing of a public hospital)
Study type 17 • Strategies that can strengthen inferences • from ecological Studies: • Multiple kinds of comparisons to strengthen • inference of association; eg, across • geographic areas and over different time • periods • Example: Valerie Beral’s study showing inverse • association between average family size and • ovarian cancer mortality using comparisons • among different birth cohorts, different countries, • and different social and ethnic groups (Lancet, 1978)
Study type 18 2. “Small Area” analysis: Used in health services research to investigate variation within small geographic areas. Reduce confounding by comparing small areas from a larger area thought to be fairly homogeneous on potential confounders (SES, disease prevalence) Example: Wennberg’s study of variation in rates of surgical procedures in 6 areas of Vermont with similar disease prevalence (Medical Care, 1987)
Study type 19 • 3. Mixed studies that collect data on • individuals but use secondary group data • for rare outcomes (multilevel studies) • Doesn’t avoid ecological fallacy but reduces confounding by key measures at individual level • Using group data may make study feasible that would be otherwise prohibitively expensive
Study type 20 • Example: Bindman’s study of health care • access (personal data) and rates of • preventable hospitalizations (group data) • in California medical service areas • (JAMA, 1995)
Study type 21 Cohort Study Design • Gold standard because exposure/risk factor • is observed before the outcome occurs • 2. Randomized trial is a cohort design in which • the exposure is assigned rather than • observed • 3. Other study designs can be understood by • the way in which they sample the experience • of a cohort
Study type 22 4. Easiest design to understand because it explicitly defines the study base as a cohort 5. Measures individual characteristics before disease occurrence fulfilling the temporal order required for cause and effect (but is not the only study design that can do this). 6. Provides conceptual basis for understanding sampling strategies of case-control, case-cohort, and cross-sectional designs
Study type 25 Cohort Study X L Subjects dying or lost to follow-up X X X D L L D X X D D D Subjects followed until end of study D D D D D Begin End Time of Follow-up X = dead L = lost D = disease
Study type 26 Fixed (closed) v.s. dynamic (open) cohort • Fixed: When the exposure groups in a cohort • study represent groups that are defined at • the start of follow-up, with no movement of • individuals between exposure groups • during the follow-up, the exposure groups • are sometimes called fixed cohorts. • Dynamic (open): It describe a population in • which the person-time experience can • accrue from a changing roster of • Individuals.
Study type 27 Cohort Design Prospective cohort design: Present exposure data --> Future diseases Retrospective cohort design: Past recorded exposure --> Diseases accumulated to the present
Study type 28 Present Future Past Follow to see if disease develops Select cohort: classify as to exposure status On basis of existing records classify individuals in cohort as to past exposure status Identify cohort defined in past Determine whether disease has develop
Study type 29 Groups Investigated in Cohort Studies A. General population sample B. Select groups of the population 1. Special groups - professional, insured, alumni, veteran, etc. 2. Exposed groups - medically or toxically exposed, occupational, etc.
Study type 31 Defining Exposed/Nonexposed Groups for Comparison I. Sources of exposure data A. Types 1. Records (e.g., hospital, employment) 2. Interviews, questionnaires 3. Direct examination 4. Indirect measures of exposure estimated from investigating the environment B. Retrospective cohort studies use records or indirect measures and generally obtain less detail on exposure (and confounding)
Study type 32 • II.Defining nonexposed • Internal comparison group • B. External comparison group • 1. Common in retrospective cohort • (especially occupational studies) • 2. Drawbacks • a. Typically assumes exposure is rare in • comparison group • b. Wrong comparison group • (e.g., Healthy worker effect) • 3. Must be certain endpoint is comparably • defined
Study type 33 III. Other considerations A. Exposed should be truly “exposed”; Non exposed truly “nonexposed.” B. Exposure should be measured similarly in exposed and nonexposed. C. Can select exposed/nonexposed groups with equal or unequal sampling fraction D. Matching E. Problem of homogeneity of exposure
Study type 34 • Follow-up • I. Objective • Uniform and complete follow-up of all cohort • groups • B. Complete ascertainment of outcome events • C. Standardized diagnosis of outcome events
Study type 35 II. Considerations A. Length of follow-up is related to : 1. The natural history of the disease 2. The incubation period (latency) between exposure and disease B. Obtain tracing information at baseline 1. Name, address, phone number 2. Age, birthdate, states of birth, maiden name 3. Social Security Number, driver’s license number 4. Name and address of friends, employer, physician
Study type 36 III. Methods A. Direct contact throughout the study 1. Correspondence, telephone 2. Re-examination B. Indirect surveillance 1. Hospitalizations/physician records 2. Disease registries 3. Death records 4. National Death Index 5. Social Security Administration 6. Pension/retirement associations
Study type 37 Sources for tracing subjects Post office Tax record Phone directory Prison system Relatives Medical record Neighbors Family physician Drivers Bureau National Death Index Schools Commercial tracing firm Veterans groups Credit bureau Union Church Employment (payroll files) Pension/Retirement association
Study type 39 Cumulative Incidence Cohort is followed a uniform length of time D D Total E a b N1 Risk = a/N1 E c d N0 Risk = c/N0 a/N1 Relative Risk = c/N0
Study type 40 Life table analysis: (Survival Analysis) Example: Assume that 100 persons have received cardiac transplants and that we wish to estimate the probability of surviving the surgery. The data was follows: Time Individual number of loss to (interval) at risk events observation 1 100 10 10 2 80 10 0 3 70 10 10 4 50 10 10 5 30 10 0 6 20 10 0
Study type 41 Life table calculation: Probability of Under observation Died during Dying during Surviving interval at time interval interval through interval 1 100 10 .1 .9 2 80 10 .125 .875 3 70 10 .143 .857 4 50 10 .2 .8 5 30 10 .333 .667 6 20 10 .5 .5 Cumulative probability of surviving 24 months is (.9) (.875) (.857) (.8) (.667) (.5) = 0.18
Study type 42 Survival Curve
Study type 43 Assumptions in the estimation of cumulative incidence based on survival analysis • Uniformity of events and losses within each • interval: • If risk increases or decreases too rapidly • within a giving interval, then calculating an • average risk (from our example,0.18) over • the interval is not fully informative. • One good way is to shortening the interval • for calculation.
Study type 44 2. Independence Between Censoring and Survival: One need to assume that the censored observations have the same probability of the event (after censoring) as those remaining under observation.
Study type 45 Examples of non-independence Between Censoring and Survival: In an outcome observation of lung cancer, participants dying from coronary heart disease are censored. Since lung cancer and CHD share an important risk factor, smoking, it is possible that individual dying from CHD would have had a higher risk of lung cancer if they had not died from heart disease. The risk of smoking will be under- estimated.
Study type 46 3. Lack of Secular Trends In studies in which the accumulative time covers an extended period, the decision to pool all individuals at time 0 assumes lack of secular trends with regard to the type and characteristics of these individuals that affect the outcome of interest.
Study type 47 Examples of lack of secular trend It would not be appropriate to carry out a survival analysis pooling at time 0 all HIV positive individuals recruited into a cohort accrued between 1995 and 1999 – that is, both before and after a new effective treatment (protease inhibitors) became available.
Study type 48 Incidence Density Cohort has variable lengths of follow-up, due to: 1. Losses to follow-up 2. Deaths 3. Termination of the study 4. No longer “at risk”(able to develop the disease) D D Person Years E a b N1 Incidence rate = a/N1 E c d N0 Incidence rate = c/N0 a/N1 Rate ratio = c/N0
Study type 49 Assumptions in the estimation of incidence rates based on person-time • Assumptions of independence between • censoring and survival • 2.Lack of secular trends
Study type 50 (continue) • 3. Estimated risk apply equally to any time unit • within the interval • n persons followed during t units of time are equivalent to t persons observed during n units of time. • The effect resulting from the exposure is not cumulative within the follow-up interval of interest
Study type 51 (continue) For example, the risk of chronic bronchitis for 1 smoker followed for 10 years is certainly not the same as that of 10 smokers followed for 1 year, In view of strong cumulative effect of smoking.
Study type 52 Incidence Rate average risks (cumulative incidence): measured with individuals as the unit in the denominator; are conceptually tied to the identification of specific cohorts of individuals, Incidence rates: have person-time as the unit of measure; can define the comparison groups in terms of person-time units that do not correspond to specific cohorts of individuals.