Download
1 / 59
590 likes | 713 Vues
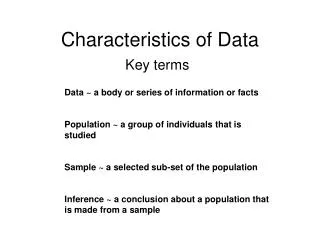
This document outlines SeaWinds scatterometer technology, its measurement capabilities, and the complexities involved in wind retrieval. It covers how scatterometers measure backscatter from ocean surface waves, providing vital data on wind speed and direction. Key aspects include the instrument's processing methods, accuracy metrics, and challenges posed by coastal measurements and extreme weather conditions. It also discusses rain's impact on wind measurements and emphasizes the importance of high-resolution data for better understanding air-sea interactions, particularly in upwelling regions.

E N D
SeaWinds Scatterometer Data: Characteristics and Challenges M. H. Freilich COAS 8 Feb 2005
Outline • What do scatterometers measure? • SeaWinds: Instrument, processing, products • Accuracy: The numbers • Challenges: • Coastal measurements • Wind Retrieval • Rain/extreme conditions
What: Interpretation of Scatterometer Wind Estimates • Scatterometers measurebackscatter • From centimetric waves • Generated (primarily) by wind stress • Scatterometer winds are “xx km resolution, 10 m neutral stability wind velocity [speed and direction]” • Speed: scalar (spatial) average over the footprint • Direction: direction of the vector (spatial) mean • Essentially instantaneous (backscatter measurements acquired within minutes)
What: Interpretation (cont.) • 10 m neutral stability wind???? • Wind speed and direction at 10 m height that would cause the observed surface stress if: • Atmosphere neutrally stratified • Motionless sea surface • No long waves Kelly et al., GRL, 2001
8/99-7/03 4-year Average Wind Stress Curl Chelton, Schlax, Freilich, Milliff, Science, 2004
8/99-7/03 4-year Average Wind Stress Curl Chelton, Schlax, Freilich, Milliff, Science, 2004
QuikSCAT: Scatterometry Basics • Active microwave radar • Day and night • Clear-sky and clouds • Scattering from short waves • “Cats paws” • In equilibrium with wind • Backscatter depends on • wind speed, direction • Multiple measurement angles • Dual scanning pencil beam • Collocated backscatter measure- • ments used to solve for wind • speed and direction
NOAA/NESDIS Storm Page (3 views) Ambiguities (2 deg grid) NOAA/NESDIS http://manati.orbit.nesdis.noaa.gov/cgi-bin/qscat_storm.pl Wind Vectors NRCS oV-pol forward
QuikSCAT: Comparison with NCEP and ECMWF Chelton and Freilich, MWR, 2005
Accuracy: QuikSCAT and NSCAT Buoy Comparisons Chelton and Freilich, MWR, 2005
QuikSCAT/Buoy:NOFAR swath Spd RMS: 1.23 m/s Spd BIAS: 0.13 m/s 3-20 m/s: 19.1 deg (5.2 deg bias) 5-20 m/s: 16.0 deg (5.2 deg bias) 3-20 m/s: 25.3 deg (5.0 deg bias) 5-20 m/s: 19.6 deg (5.1 deg bias)
L2B vs. DIRTH:Nadir swath 3-20 m/s: 23.5 deg (4.7 deg bias) 5-20 m/s: 20.7 deg (5.1 deg bias) 3-20 m/s: 19.6 deg (4.7 deg bias) 5-20 m/s: 16.3 deg (5.1 deg bias) 3-20 m/s: 27.8 deg (4.7 deg bias) 5-20 m/s: 23.0 deg (5.0 deg bias) 3-20 m/s: 23.3 deg (4.7 deg bias) 5-20 m/s: 18.6 deg (5.0 deg bias)
Outline • What do scatterometers measure? • SeaWinds: Instrument, processing, products • Accuracy: The numbers • Challenges: • Coastal measurements • Wind Retrieval • Rain/extreme conditions
Summer CZCS Image of US West Coast Equatorward winds cause coastal upwelling -- Low SST near coast -- High productivity -- Complex air-sea interaction Pigment Temperature
Effect of 30 km scatterometer land mask NO accurate wind data over the critical upwelling region High resolution winds will allow study of air-sea interaction in coastal upwelling areas Pigment Temperature
12.5 km Hi-Res “MGDR-slice” Winds • Near-real-time product • 12.5 km backscatter measurements from QSCAT slices • “Composite2” processing to yield 4 so per retrieval • Standard MLE wind retrieval algorithm • Erroneous wind variability (noise) • Poor far-swath performance • Systematic spikes in wind speed histograms • In the 21st century, why must NOAA provide degraded products?
New12.5 km Hi-Res “Research-Slice” Winds • Offline (non-real-time) product • 12.5 km backscatter measurements from QSCAT slices • No compositing: up to 16 so msmts per retrieval • Refined MLE wind retrieval algorithm • Cubic spline + log-log wind speed model function interpolation • Improved optimization algorithm for objective function extrema • Full 5+ year reprocessing complete
Rain • Scatterometer wind measurement assumes: • Power minus noise comes from surface • Surface geometry is caused by wind • Rain violates the assumptions: • Scattering/attenuation (non-surface) • Rain-induced surface roughness (non-wind) • Multi-channel radiometers provide (some) independent data • Correction/elimination of rain-contaminated so msmts. • AMSR on ADEOS-2 • QSCAT challenge – combine limited data in unique ways to indicate presence of rain
QuikSCAT Rain Detection Hurricane Floyd Tb • Noise measurements (minus signal) yield estimates of Tb (increases w/ rain rate) • Rain increases h-pol/v-pol ratio (esp. for low wind speed) • Rain increases backscatter variability • Tendency for retrieved direction to cross-track • NOF (Mears et al.) • Single-parameter, no QSCAT Tb • Best for low wind speeds (< 15 m/s) • MUDH (Huddleston and Stiles) • Table lookup, trained vs SSM/I 2 km*mm/hr • Includes QSCAT Tb D. G. Long, BYU W. L. Jones, UCF
Rain Contaminated 95 kt max GALE STORM HURCN FORCE WHITE- HURCN FORCE Joe Sienkiewicz - MPC
QuikSCAT/Buoy:Rain vs. non-Rain (dir. edit) Spd RMS: 4.40 m/s Spd BIAS: 2.58 m/s Spd RMS: 1.23 m/s Spd BIAS: 0.13 m/s
QuikSCAT/Buoy:Rain vs. non-Rain (dir. edit) Spd RMS: 4.40 m/s Spd BIAS: 2.58 m/s Spd RMS: 1.23 m/s Spd BIAS: 0.13 m/s
DIRTH:Rain vs. non-Rain (dir. edit) Spd RMS: 4.46 m/s Spd BIAS: 2.90 m/s Spd RMS: 1.26 m/s Spd BIAS: 0.19 m/s
DIRTH:Nadir vs. “Sweet” swath (dir. edit.) 3-20 m/s: 23.5 deg (4.7 deg bias) 5-20 m/s: 20.7 deg (5.1 deg bias) 3-20 m/s: 17.1 deg (5.2 deg bias) 5-20 m/s: 13.9 deg (5.1 deg bias) 3-20 m/s: 23.3 deg (4.7 deg bias) 5-20 m/s: 18.6 deg (5.0 deg bias) 3-20 m/s: 23.7 deg (5.0 deg bias) 5-20 m/s: 18.0 deg (4.9 deg bias)
L2B vs. DIRTH:“Sweet” swath (dir. edit.) 3-20 m/s: 18.2 deg (5.3 deg bias) 5-20 m/s: 15.0 deg (5.2 deg bias) 3-20 m/s: 17.1 deg (5.2 deg bias) 5-20 m/s: 13.9 deg (5.1 deg bias) 3-20 m/s: 24.9 deg (5.1 deg bias) 5-20 m/s: 19.0 deg (5.1 deg bias) 3-20 m/s: 23.7 deg (5.0 deg bias) 5-20 m/s: 18.0 deg (4.9 deg bias)
3-20 m/s: 17.5 deg (5.1 deg bias) 5-20 m/s: 14.3 deg (5.1 deg bias) DIRTH:NOFAR swath Spd RMS: 1.23 m/s Spd BIAS: 0.13 m/s 3-20 m/s: 23.6 deg (4.9 deg bias) 5-20 m/s: 18.1 deg (4.9 deg bias)
MUDH Rain Expected Performance vs. SSM/I Huddleston and Stiles, 2000
QuikSCAT: Rain Flag • Absorption and scattering from rain • and heavy clouds degrades • wind velocity accuracy • Multi-Dimensional Histogram Rain Flag • Normalized beam difference • Measured speed • MLE misfit • Radiometer mode Tb (H,V) • Table-driven, trained with SSM/I • ~5% flag rate (approx. 2 km mm/hr) • Rain-free data has improved quality • 24% speed rms decrease, 3-7 m/s • Active/Passive environmental retrievals • will be possible with SWS and AMSR on • ADEOS-II
QuikSCAT Radiometer Mode Hurricane Floyd Tb • QuikSCAT noise measurements contribute to autonomous rain flag capability • Careful calibration/analysis allows subtraction of signal energy from 1 MHz bandwidth noise measurements, and interpretation of noise measurements as brightness temperature • QSCAT radiometer mode data compare well with space/time collocated SSM/I rain rates and water contents D. G. Long, BYU W. L. Jones, UCF
REMARKS: 262100Z1 POSITION NEAR 21.4N7 130.6E0. TROPICAL STORM (TS) 20W (PRAPIROON), LOCATED APPROXIMATELY 375 NM SOUTH-SOUTHEAST OF OKINAWA HAS TRACKED NORTH NORTHWESTWARD AT 20KNOTS OVER THE PAST 6 HOURS. THE WARNING POSITION IS BASED ON 261730Z9 INFRARED SATELLITE IMAGERY. THE WARNING INTENSITY IS BASED ON SATELLITE CURRENT INTENSITY ESTIMATES OF 30 AND 35 KNOTS AND A SHIP REPORT OF 35 KNOTS. ANIMATED ENHANCED INFRARED SATELLITE IMAGERY DEPICTS CONVECTION IS SHEARED 15 NM TO THE NORTH AND EAST OF A PARTIALLY EXPOSED LOW LEVEL CIRCULATION CENTER (LLCC). IMAGERY ALSO INDICATES CONVECTION HAS INCREASED IN INTENSITY OVER THE PAST 06 HOURS. UW-CIMSS ANALYSIS AND THE 200 MB ANALYSIS INDICATE OUTFLOW ALOFT CONTINUES TO IMPROVE AS THE TROPICAL UPPER-TROPOSPHERIC TROUGH (TUTT) TO THE WEST CONTINUES TO FILL. A 260916Z4 QUIKSCAT PASS INDICATED A WELL DEFINED LLCC WITH LIGHTER WINDS AROUND THE CENTER AND STRONGER WINDS ON THE PERIPHERY. THE SYSTEM IS FORECAST TO TRACK NORTHWESTWARD THROUGH 24 HOURS, THEN INCREASINGLY WEST-NORTHWESTWARD AS THE SUB-TROPICAL RIDGE BUILDS IN NORTH OF THE SYSTEM. THE 35 KNOT WIND RADII HAVE BEEN INCREASED BASED ON THE 260916Z4 QUIKSCAT PASS. QuikSCAT:Operational Applications National Weather Service Advisory National Weather Service Meteorological Data Assimilation Software Display QuikSCAT data has become a high priority data set for weather forecasters QuikSCAT data is a significant resource for a significant number of advisories issued Joe Sienkiewicz, Lead Forecaster, NWS Marine Prediction Center Jeff Hawkins, Naval Research Laboratory, Monterey, CA 93943