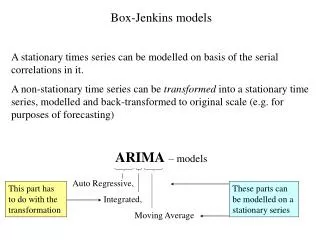
The Dual Simple Moving Average Crossover
The Dual Simple Moving Average Crossover. Emerging Investors Javier Hazan Sergio Kurlat Felipe Monteiro Eugen Nuri The Fuqua School of Business Duke University February 28, 2005. FINANCE 453 (Global Asset Allocation and Stock Selection). A widely used used technical indicator.

The Dual Simple Moving Average Crossover
E N D
Presentation Transcript
The Dual Simple Moving Average Crossover Emerging Investors Javier Hazan Sergio Kurlat Felipe Monteiro Eugen Nuri The Fuqua School of Business Duke University February 28, 2005 FINANCE 453 (Global Asset Allocation and Stock Selection)
A widely used used technical indicator • Designed to smooth out temporary fluctuations and reveal the true path of trends. • Best performance in broad, trending markets • Easy to use (simple math) FINANCE 453 (Global Asset Allocation and Stock Selection)
One moving average • Compares current price vs. MA • Sends signals early • Picks up many false signals FINANCE 453 (Global Asset Allocation and Stock Selection)
Multiple moving averages • Long MA identifies trend; short MA used for timing • Limits the amount of false signals FINANCE 453 (Global Asset Allocation and Stock Selection)
DMAC • Typically long:short MAs on a 8:1 ratio • Usually sends signal after crossover FINANCE 453 (Global Asset Allocation and Stock Selection)
Emerging investors: Model #1 “Ratio before crossover” FINANCE 453 (Global Asset Allocation and Stock Selection)
Emerging investors: Model #1 “Ratio before crossover” FINANCE 453 (Global Asset Allocation and Stock Selection)
Emerging investors: Model #2 “Unit ratio” FINANCE 453 (Global Asset Allocation and Stock Selection)
Emerging investors: Model #3 “Ratio after crossover” FINANCE 453 (Global Asset Allocation and Stock Selection)
Emerging investors: Model #4 “Product after crossover” FINANCE 453 (Global Asset Allocation and Stock Selection)
Results • Ratio after crossover ratio after crossover (quintiles, long) 2.50 2.00 1.50 1.00 0.50 0.00 1 2 3 4 5 FINANCE 453 (Global Asset Allocation and Stock Selection)
Results • Ratio after crossover ratio after crossover (quintiles, short) 2.50 2.00 1.50 1.00 0.50 0.00 1 2 3 4 5 FINANCE 453 (Global Asset Allocation and Stock Selection)
Results • Ratio after crossover LONG SHORT Equal Wgt. Std Dev. Equal Wgt. Std Dev. Return Return 2.18 7.7 0.19 8.14 1.29 7.91 1.35 7.46 1.02 6.45 2.01 8.5 0.88 5.88 2.02 13.17 2.1 7.75 1.05 7.84 FINANCE 453 (Global Asset Allocation and Stock Selection)
Results • Ratio after crossover: Fractile 1 comparative returns 25% 20% 15% Long Fractile 1 Annual Return S&P500 10% 5% 0% 1996 1997 1998 1999 2000 2001 2002 2003 2004 Year FINANCE 453 (Global Asset Allocation and Stock Selection)
Results • Ratio after crossover: Fractile 1 comparative Sharpe ratio 5 4 4 3 3 Long Fractile 1 Ratio 2 S&P500 2 1 1 0 1996 1997 1998 1999 2000 2001 2002 2003 2004 Year FINANCE 453 (Global Asset Allocation and Stock Selection)