Introduction to GIS Techniques for Urban Planning
100 likes | 529 Vues
Explore how Geographic Information Systems (GIS) revolutionize urban planning with data integration, analysis, and visualization. Learn about GIS elements, techniques, data types, advantages, and applications.

Introduction to GIS Techniques for Urban Planning
E N D
Presentation Transcript
BLOCK3: URBAN PLANNING REGULATION Lesson 3: Information systems for urban planning and management GIS Geographic Information System This project is implemented through the CENTRAL EUROPE Programme co-financed by the ERDF
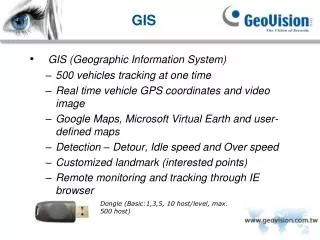
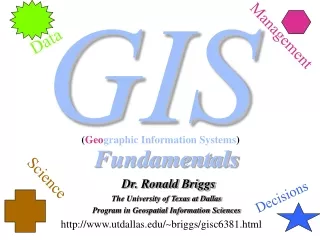
GIS Definition? GIS is a system designed to capture, store, manipulate, analyze, manage and present all types of geographically referenced data. OR GIS is the merging of cartography, statistical analysis and database technology.
The term GIS describes any information system that integrates, stores, edits, analyzes, shares and displays geographic information for informing decision making. Applications are tools that allow users to create interactive queries (user-created searches), analyze spatial information, edit data, maps, and present the results of all these operations. • Elements are: • Hardware • Software • Data • Methods • People This project is implemented through the CENTRAL EUROPE Programme co-financed by the ERDF
GIS techniques • GIS systems use digital information, for which various digitized data creation methods are used. The most common method of data creation is digitization, where a hard copy map or survey plan is transferred into a digital medium through the use of a computer-aided design (CAD) program, and geo-referencing capabilities. • With the wide availability of ortho-rectified imagery (both from satellite and aerial sources), heads-up digitizing is becoming the main avenue through which geographic data is extracted. Heads-up digitizing involves the tracing of geographic data directly on top of the aerial imagery instead of by the traditional method of tracing the geographic form on a separate digitizing tablet (heads-down digitizing).
Data types There are two broad methods used to store data in a GIS for both kinds of abstractions mapping references: raster images and vector. This project is implemented through the CENTRAL EUROPE Programme co-financed by the ERDF
Advantages and disadvantages • Advantages and disadvantages to using a raster or vector data model to represent reality: • Raster datasets record a value for all points in the area covered which may require morestorage space than representing data in a vector format that can store data only where needed. • Raster data allows easy implementation of overlay operations, which are more difficult with vector data. • Vector data can be displayed as vector graphics used on traditional maps, whereas raster data will appear as an image that may have a blocky appearance for object boundaries. (depending on the resolution of the raster file) • Vector data can be easier to register, scale, and re-project, which can simplify combining vector layers from different sources. • Vector data is more compatible with relational database environments, where they can be part of a relational table as a normal column and processed using a multitude of operators. • Vector file sizes are usually smaller than raster data, which can be tens, hundreds or more times larger than vector data (depending on resolution). • Vector data is simpler to update and maintain, whereas a raster image will have to be completely reproduced. (Example: a new road is added). • Vector data allows much more analysis capability, especially for "networks" such as roads, power, rail, telecommunications, etc. (Examples: Best route, largest port, airfields connected to two-lane highways). Raster data will not have all the characteristics of the features it displays. This project is implemented through the CENTRAL EUROPE Programme co-financed by the ERDF
Geographical features Geographical features are often expressed as vectors, by considering those features as geometrical shapes. Different geographical features are expressed by different types of geometry: Points, Lines and Polygons. Each of these geometries are linked to a row in a database that describes their attributes. This project is implemented through the CENTRAL EUROPE Programme co-financed by the ERDF
What is not GIS ? • GPS – Global Positioning System • Paper map or digital map – Maps are product of a GIS system – Different ways of presenting GIS analysis • GIS Software Why use GIS? • Better data organization • Support for making decisions • Many different kind of analysis results presented as readable maps