Download
1 / 62
760 likes | 1.1k Vues
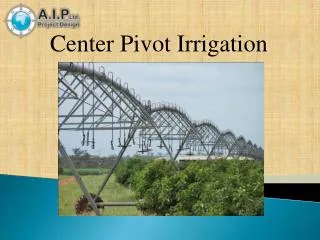
Growing Rice Using Center Pivot Irrigation. Earl Vories. Ph.D. - Agricultural Engineering Professional Engineer - Arkansas University of Arkansas: 1988 - 2004 USDA-ARS: 2004 - present Agricultural Engineer, Lead Scientist Delta Research Center, Portageville, MO Earl.Vories@ars.usda.gov.

E N D
Earl Vories • Ph.D. - Agricultural Engineering • Professional Engineer - Arkansas • University of Arkansas: 1988 - 2004 • USDA-ARS: 2004 - present • Agricultural Engineer, Lead Scientist • Delta Research Center, Portageville, MO • Earl.Vories@ars.usda.gov Mention of trade names or commercial products is solely for purpose of providing specific information and does not imply recommendation or endorsement by the U.S. Department of Agriculture.
CEU Credit • This 60 minute seminar is worth 1 CEU • CEUs are only available to those who have a full registration. • Reminder to keep documentation of your participation. • Turn in your completed form at the IA bookstore in the Resource Center in the exhibition hall.
More than half of US rice produced in Mid-South • Almost half in Arkansas • Mostly produced in flooded culture • Generally requires more irrigation water than other crops produced in the region • Published estimate for Arkansas: 760 mm, based on several years of on-farm observations • Vories et al. (2006) reported 460 - 1435 mm for 33 Arkansas fields during 2003 through 2005 • Smith et al. (2006) reported 382 - 1034 mm in Mississippi in 2003 and 2004
Mid-South Rice Production Dry-seeding system most common • crop flooded ~V-4 growth stage • continuous flood until after heading • insufficient irrigation water results in dry portions of the fields • increased weed problems • fertilizer problems • low yields
Mid-South Rice Production Dry-seeding system common in Mid-South • excessive water also problem • wastes water • wastes energy to pump excess water • increases pressure on levees • soil, fertilizers, pesticides may be in runoff • Insufficient water generally of more concern to producers, at least when energy prices were lower
Rice Field Well Irrigation Tubing Levee spill Field Slope (~0.1%) Levee (~60 mm VI) Field Drain
By 1915 the alluvial aquifer, principal water source for agriculture in eastern Arkansas and surrounding areas, already being tapped at rate exceeding recharge in some areas (Corps of Engineers) • problem exacerbated as Arkansas rice production increased to >650,000 ha; also increased in Mississippi, Louisiana, and Missouri
Surface Irrigation • Burt et al. (2000) reported potential application efficiency for continuous flood irrigation 80% under practical conditions • within center pivot systems range (75 - 90%) • added that surface irrigation systems "require the most 'art' of all the irrigation methods, both to obtain a high distribution uniformity and a high application efficiency. In general, people have not learned the art.”
Surface Irrigation In practice, much water lost from surface irrigated fields • Mid-South operations spread over large areas • farmers simultaneously managing several irrigation systems • one worker responsible for several fields • each field waters differently • often differences within fields due to highly variable soils.
Rice Production Systems • Different production systems investigated to reduce water requirement with varying levels of success • furrow irrigation • delayed flooding • intermittent flooding • multiple inlet rice irrigation • 0 grade • Only multiple inlet and 0 grade have been very widely adopted so far
Center Pivot Rice Production Center pivot irrigated rice production investigated in 1980's • Problems observed precluded adoption • weed control • disease (blast) • towers got stuck • low yield (maybe due to others)
Center Pivot Rice Production • renewed interest in US and especially internationally • improved cultivars and hybrids • additional herbicides • Improved tower/sprinkler arrangement
Traction Alternatives 3- and 4-wheel drive on towers Boomback puts sprinkler behind wheel (if only running in one direction)
Center Pivot Rice Production Valmont began working with University of Missouri/ARS and several Mid-South growers on pivot-irrigated rice in 2008
Irrigation Method • When rice produced in flooded culture, water uniformly available across the field • With a center pivot (sprinkler) system • distribution uniformity of the irrigation system impacts how much water is delivered to an area • well designed/maintained systems have high uniformity
Irrigation Method • With a center pivot (sprinkler) system • soil variability combined with distribution uniformity leads to site-specific differences in how much of that water available to plants Soil Mapping Units Cm: Commerce silt loam Cn: Convent fine sandy loam Sk: Sharkey-Crevasse complex Sm: Sharkey-Steele complex So: Steele loamy sand Tu: Tunica silty clay
Irrigation Method • Center pivot systems typically have application efficiencies as high as 90% • Combination of alluvial, wind, and seismic activity has resulted in highly variable soils in the Mid-South • common to have sand - clay in same field • Will highly variable Mid-South soils negatively impact the spatial distribution of yield with sprinkler irrigation? • Can variable rate irrigation (VRI) adequately compensate?
Water savings (relative to flood) not always goal; in many cases goal is to bring rice into crop rotation where flooded production was not practical MU Delta Center Marsh Farm field where earlier drip irrigation and flood comparison (Brian Ottis); flooded treatments that were filled in the morning would have exposed soil by evening field where center pivot rice study conducted
How do Flood and Center Pivot Rice Production Compare • With new interest in center pivot irrigated rice, many producers have questions concerning how the yields compare to flooded production and the costs involved • Working with area farmer, able to compare grain yield and costs between RRVP flooded rice field and field grown by same producer with center pivot irrigation
Rice Research Verification Program (RRVP) • University of Arkansas Cooperative Extension Service established RRVP, interdisciplinary program that represents public exhibition of implementation of research-based Extension recommendations in an actual field scale farming environment in 1983. • The producer agrees to pay production expenses, provide expense data, and implement university recommendations in a timely manner from planting to harvest. • RRVP has been conducted on over 300 commercial rice fields in more than 30 rice-producing Arkansas.
McCarty Farms participated in RRVP, also cooperated with Lindsay on center pivot rice on field near Osceola, Arkansas McCarty RRVP rice field McCarty pivot rice field
2009 aerial images of rice fields showing soil mapping units within fields. Soil Mapping Units Cm: Commerce silt loam Cn: Convent fine sandy loam Sk: Sharkey-Crevasse complex Sm: Sharkey-Steele complex So: Steele loamy sand Tu: Tunica silty clay a) RRVP Field b) Center Pivot Field
Methods and Materials • RiceTec hybrid 'Clearfield XL745‘ • Both fields scouted; pesticides applied as needed, with different applications to each field based on observed problems • Ground application used for fertilizers and pesticides in RRVP field during early season; aerial application used after flood initiation • Ground application was used for all pesticides on the center pivot rice; combination of aerial application, ground application, and fertigation used for fertilizer
Findings RRVP field • Irrigated with diesel-powered pumping plant • flood initiated at approximately the V-4 growth stage • maintained until after heading • Multiple Inlet irrigation used • propeller-type flowmeter installed between the well and irrigation tubing • 690 mm of rainfall recorded at field • 589 mm of irrigation water applied to crop
Findings center pivot field • electric pump and center pivot system • pivot used to germinate seed, incorporate herbicide • no established recommendations for center pivot rice production, so 18-mm applications made ~every other day in absence of rain, mid-May until ~80% of rice kernels brown • Rainfall not recorded at field • 690 mm recorded at RRVP field - 12 km • 660 mm recorded at U Ark NEREC - 6 km • 460 mm of irrigation water applied to the crop
Estimated irrigation costs • The differences between total estimated costs influenced by the different power sources (i.e., electric for pivot; diesel for the RRVP). • Electric systems have higher efficiencies so electricity generally used when 3-phase power is available. • An electrically powered system on RRVP would have been expected to have total cost of $139 ha-1, or $57 ha-1 less than the diesel system. • Many agricultural areas in Arkansas do not have access to 3-phase power • < one-third of irrigated area in Arkansas used electric systems in 2008.
Yields • The observed grain yields were similar • 10.1 Mg ha-1 average (dry) – RRVP field • 9.7 Mg ha-1 average (dry) – center pivot field • Irrigation water use efficiency (IWUE; ratio of yield and irrigation water applied) higher than reported for conventional (0.9 kg m-3) and multiple inlet (1.2 kg m-3)* • 1.7 kg m-3 for RRVP field • 2.1 kg m-3 for pivot irrigated field * Vories et al., 2005
Interpolated surfaces of grain yield (Mg ha-1) measured by the yield monitors. Dry Yield (Mg ha-1) Variety test harvested separately Dry Yield (Mg ha-1) a) RRVP Field b) Center Pivot Field
Total costs (pesticide, fertilizer, and estimated irrigation, exclusive of ownership costs) • $817 ha-1 for RRVP field • $601 ha-1 for pivot irrigated field
Conclusions • Acceptable yield obtained with center pivot irrigation (9.7 Mg ha-1, 192 bushels/acre) • Average yields consistent among soil mapping units • Interpolated yield maps did not indicate patterns corresponding to the mapping units or other factors • Highly variable Mid-South soils did not appear to negatively impact the spatial distribution of yield • Water was probably saved relative to flooded production (no direct statistical comparison)
Conclusions • Results suggest center pivot irrigated rice is viable production system. • Other studies (Vories et al., 2010) and demonstrations (J. LaRue, personal communication, 2009) also resulted in satisfactory production with center pivot irrigation. • Additional research should soon lead to production recommendations for producers interested in the system.
Irrigation Management Irrigation scheduling more difficult in sub-humid regions than arid • Clouds, rainfall, temperature swings all complicate irrigation scheduling • Weather conditions vary greatly year to year and within year • Most scheduling methods measure or estimate soil water content • highly variable soils limited measurements
Irrigation Management • Methods that estimate soil water content rely on crop coefficient to relate ETc (crop) to ETo(reference) • single coefficient: effects of transpiration and evaporation combined (Kc) • dual coefficient: effects of crop transpiration and soil evaporation determined separately • basal coefficient (Kcb) describing plant transpiration • evaporation coefficient (Ke) describing evaporation from the soil surface
Irrigation Management Since US rice almost always produced with flood irrigation, little work devoted to scheduling rice irrigation Objective: develop procedure for scheduling irrigations on sprinkler irrigated rice
Methods • Cultivar/hybrid and fertility studies with center pivot irrigation • Field irrigated 13 mm on alternate days • Watermark sensors placed in four locations • Irrigation ceased when grain color suggested maturity • Experimental crop coefficient developed and included in beta version of AIS • Daily ETo calculated from weather data collected on site
Pivot Rice at Portageville, 18 acres Large-scale Variety test Weed control No Fertigation Nitrogen Variety test No Fungicide
Basal Rice Crop Coefficient, Short Grass Reference FAO 56 - assuming 5 days planting to emergence Arkansas Irrigation Scheduler beta version
Center Pivot Rice Study Area Showing Soil Mapping Units Soil Mapping Units Dd = Dundee sandy loam De = Dundee silt loam Re = Reelfoot loam Rf = Reelfoot sandy loam Tp = Tiptonville silt loam
Real-time Weather at University of Mo. Delta Research Center Marsh Farm (http://agebb.missouri.edu/weather/realtime/portageville.asp)