Methods for Estimating Distributions
Explore grid and polygon methods for habitat mapping, distribution estimation, and species occurrence prediction. Learn about the application of population-environment models, evaluation techniques like GAP Analysis, and factors influencing species distributions.


Methods for Estimating Distributions
E N D
Presentation Transcript
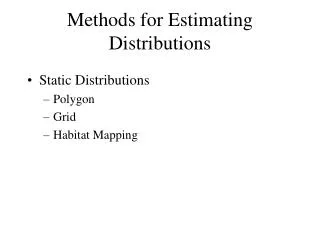
Methods for Estimating Distributions • Static Distributions • Polygon • Grid • Habitat Mapping
Polygon Method • Relies on empirical knowledge of specialists • Likelihood of occurrence unspecified
Blackpoll Warbler Distribution in New York State • “Grid” Method • Delineated by all subunits where presence in confirmed • Likelihood of occurrence unspecified
Habitat Mapping • 2 Phases • Model population-environment relationship • Model distribution • Example bull trout in Nevada and southern Idaho (Dunham et al. 2002) Dunham, J. B., B. E. Rieman, and J. T. Peterson. 2002. Patch-based models to predict species occurrence: lessons from salmonid fishes in streams. In Predicting Species Occurrences.
Goal: Predict occurrence of fish in patches of habitat suitable for local breeding populations
Possible Factors Affecting Bull Trout Distributions • Natural and artificial dispersal barriers • Water temperature • Interactions with non-native salmonids and other fishes (brook trout) • Human disturbance (road density) • Geographic influences (‘patch size’, stream gradient and width)
Population-Environment Model • Used logistic regression to model probability of occurrence based on various combinations of several factors • Likely limiting factor for Nevada and southern Idaho was warm summer temps • Used elevation as surrogate for water temp. to delineate downstream distribution limit • “Patch” size • Delineated upstream patch area as size of watershed upstream from lower limit
Distribution Evaluation • Patches with >.5 probability-of-occurrence were predicted to be occupied • Evaluation: Cross-validation
GAP Analysis • GAP seeks to identify “gaps” that may be filled through establishment of new reserves or changes in land management • Maps species distributions by combining habitat mapping method with known occurrence data
Required Information for GAP • Digital map of vegetation, cover types, or habitat types • Digital map of study are divided into geographic units (e.g., counties, grid) • Database indicating presence/absence in each geographic unit • Database predicting presence/absence in each vegetation or habitat type
Example: 100 Breeding birds in California(Garrison and Lupo 2002) • Included habitats rated as Low, Medium or High by the California Wildlife Habitat Relationships (CWHR) system • Map further refined by retaining habitat polygons in counties where species was known to breed
Distribution Evaluation • Tested map predictions against Breeding Bird Survey records from 1977-1996
Accuracy Dependent On… • Maps most accurate for species that were • Relatively abundant • Relatively large breeding ranges • Territorial • Associated with terrestrial habitats