Download
1 / 1
10 likes | 134 Vues
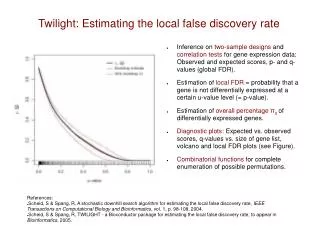
This paper discusses the estimation of the local false discovery rate (local FDR) in the context of two-sample designs and correlation tests for gene expression data. It provides insights into observed and expected scores, p- and q-values, and the overall percentage of differentially expressed genes. Diagnostic plots are presented to visualize expected versus observed scores, and the paper references a stochastic downhill search algorithm for local FDR estimation, along with a Bioconductor package called TWILIGHT for practical application.

E N D
Twilight: Estimating the local false discovery rate • Inference on two-sample designs and correlation tests for gene expression data: Observed and expected scores, p- and q-values (global FDR). • Estimation of local FDR = probability that a gene is not differentially expressed at a certain u-value level (= p-value). • Estimation of overall percentage π0of differentially expressed genes. • Diagnostic plots: Expected vs. observed scores, q-values vs. size of gene list, volcano and local FDR plots (see Figure). • Combinatorial functions for complete enumeration of possible permutations. References: • Scheid, S & Spang, R, A stochastic downhill search algorithm for estimating the local false discovery rate, IEEE Transactions on Computational Biology and Bioinformatics, vol. 1, p. 98-108, 2004. • Scheid, S & Spang, R, TWILIGHT - a Bioconductor package for estimating the local false discovery rate, to appear in Bioinformatics, 2005.