Download
1 / 32
340 likes | 527 Vues
8. Classical Macroeconomics in the AD-AS Model. Abel, Bernanke and Croushore (chapter 10). Syllabus Outline. 1. Introduction to Macroeconomics 2. The measurement and structure of the national economy 3. Goods market equilibrium: the IS curve 4. Money market equilibrium: the LM curve

E N D
8. Classical Macroeconomics in the AD-AS Model Abel, Bernanke and Croushore (chapter 10)
Syllabus Outline 1. Introduction to Macroeconomics 2. The measurement and structure of the national economy 3. Goods market equilibrium: the IS curve 4. Money market equilibrium: the LM curve 5. The IS-LM model 6. Demand-side policies in the IS-LM model (Keynesian Macroeconomics) 7. The Aggregate Supply curve 8. Classical Macroeconomics in the AD-AS model 9. Keynesian Macroeconomics in the AD-AS model 10. The relationship between Unemployment and Inflation
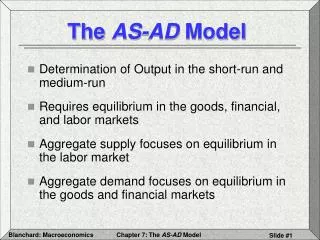
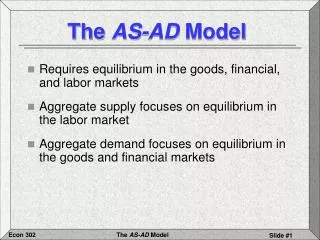
Our goals in this chapter Goals A) Use the IS-LM model with rapidly adjusting wages and prices to present the classical model B) Examine the relationship between money and the business cycle Outlook of the presentation A) Business Cycles in the Classical Model B) Money in the Classical Model C) The Misperceptions Theory and the Nonneutrality of Money
Business Cycles in the Classical Model A) The real business cycle theory B) Fiscal policy shocks in the classical model C) Unemployment in the classical model D) Household production
Business Cycles in the Classical Model A) The real business cycle theory 1. Two key questions about business cycles a. What are the underlying economic causes? b. What should government policymakers do about them? 2. Any business cycle theory has two components a. A description of the types of shocks believed to affect the economy the most b. A model that describes how key macroeconomic variables respond to economic shocks
Business Cycles in the Classical Model A) The real business cycle theory (cont.) 3. Real business cycle (RBC) theory (Kydland and Prescott) a. Real shocks to the economy are the primary cause of business cycle b. The largest role is played by shocks to the production function, which the text has called supply shocks, and RBC theorists call technology shocks c. The recessionary impact of an adverse technology shock d. Real business cycle theory and the business cycle facts
Business Cycles in the Classical Model A) The real business cycle theory (cont.) 4. Application: Calibrating the business cycle a. A major element of RBC theory is that it attempts to make quantitative, not just qualitative, predictions about the business cycle b. RBC theorists use the method of calibration to work out a detailed numerical example of the theory
Figure 10.1Actual versus simulated volatilities of key macroeconomic variables
Figure 10.2Actual versus simulated correlations of key macroeconomic variables with GNP
Business Cycles in the Classical Model A) The real business cycle theory (cont.) 5. Are Productivity shocks the only source of recessions? a. Critics of the RBC theory suggest that except for the oil price shocks of 1973, 1979, and 1990, there are no technology shocks that one can easily identify that caused recessions b. One RBC response is that it doesn’t have to be a big shock; instead, the accumulation of many small shocks can cause a business cycle
Business Cycles in the Classical Model A) The real business cycle theory (cont.) 6. Does the Solow residual measure technology shocks? a. RBC theorists measure productivity shocks as the Solow residual b. The Solow residual is strongly procyclical in U.S. data c. But should the Solow residual be interpreted as a measure of technology? d. Measured productivity can vary even if the actual technology doesn’t change e. Conclusion. Changes in the measured Solow residual don’t necessarily reflect changes in technology
Business Cycles in the Classical Model A) The real business cycle theory (cont.) 7. Technology shocks may not lead to procyclical productivity a. Research shows that technology shocks are not closely related to cyclical movements in output b. Shocks to technology are followed by a transition period in which resources are reallocated c. Initially, less capital and labor are needed to produce the same amount of output d. Later, resources are adjusted and output increases 8. Also, the critics suggest that shocks other than technology shocks, such as wars and military buildups, have caused business cycles
Business Cycles in the Classical Model B) Fiscal policy shocks in the classical model 1. The effects of a temporary increase in government expenditures (Figure 10.4 in the text)
Figure 10.4Effects of a temporary increase in government purchases
Business Cycles in the Classical Model B) Fiscal policy shocks in the classical model 1. The effects of a temporary increase in government expenditures (cont.) a. The current or future taxes needed to pay for the government expenditures effectively reduce people’s wealth, causing an income effect on labor supply b. The increased labor supply leads to a fall in the real wage and a rise in employment c. The rise in employment increases output, so the FE line shifts to the right d. The temporary rise in government purchases shifts the IS curve up and to the right as national saving declines
Business Cycles in the Classical Model B) Fiscal policy shocks in the classical model 1. The effects of a temporary increase in government expenditures (cont.) e. It’s reasonable to assume that the shift of the IS curve is bigger than the shift of the FE line, so prices must rise to shift the LM curve up and to the left to restore equilibrium f. Since employment rises, average labor productivity declines; this helps match the data better, since without fiscal policy the RBC model shows a correlation between output and average labor productivity that is too high g. So adding fiscal policy shocks to the model increases its ability to match the actual behavior of the economy
Business Cycles in the Classical Model B) Fiscal policy shocks in the classical model 2. Should fiscal policy be used to dampen the cycle? a. Classical economists oppose attempts to dampen the cycle, since prices and wages adjust quickly to restore equilibrium b. Besides, fiscal policy increases output by making workers worse off, since they face higher taxes c. Instead, government spending should be determined by cost- benefit analysis d. Also, there may be lags in enacting the correct policy and in implementing it e. It’s also not clear how much to change fiscal policy to get the desired effect on employment and output
Business Cycles in the Classical Model C) Unemployment in the classical model 1. In the classical model there is no unemployment; people who aren’t working are voluntarily not in the labor force 2. In reality measured unemployment is never zero, and it is the problem of unemployment in recessions that concerns policymakers the most 3. Classical economists have a more sophisticated version of the model to account for unemployment a. Workers and jobs have different requirements, so there is a matching problem b. It takes time to match workers to jobs, so there is always some unemployment c. Unemployment rises in recessions because productivity shocks cause increased mismatches between workers and jobs d. A shock that increases mismatching raises frictional unemployment and may also cause structural unemployment if the types of skills needed by employers change e. So the shock causes the natural rate of unemployment to rise; there’s still no cyclical unemployment in the classical model
Business Cycles in the Classical Model C) Unemployment in the classical model (cont.) 4. Davis and Haltiwanger show that there is a tremendous amount of churning of jobs both within and across industries (see next slide) 5. But this worker match theory can’t explain all unemployment a. Many workers are laid off temporarily; there’s no mismatch, just a change in the timing of work b. If recessions were times of increased mismatch, there should be a rise in help-wanted ads in recessions, but in fact they fall 6. So can the government use fiscal policy to reduce unemployment? a. Doing so doesn’t improve the mismatch problem b. A better approach is to eliminate barriers to labor-market adjustment by reducing burdensome regulations on businesses or by getting rid of the minimum wage
Figure 10.5Rates of job creation and job destruction in U.S. manufacturing, 1973–1993
Business Cycles in the Classical Model D) Household production 1. The RBC model matches U.S. data better if the model accounts explicitly for output produced at home 2. Household production is not counted in GDP but it represents output 3. Rogerson and Wright used a model with household production to show that such a model yields a higher standard deviation of (market) output than a standard RBC model, thus more closely matching the data 4. Parente, Rogerson, and Wright showed that after household production is accounted for, income differences across countries are not as large as the GDP data show
Money in the Classical Model A) Monetary policy and the economy Money is neutral in both the short run and the long run in the classical model, because prices adjust rapidly to restore equilibrium B) Monetary nonneutrality and reverse causation 1. If money is neutral, why does the data show that money is a leading, procyclical variable? a. Increases in the money supply are often followed by increases in output b. Reductions in the money supply are often followed by recessions
Money in the Classical Model B) Monetary nonneutrality and reverse causation (cont.) 2. The classical answer: Reverse causation a. Just because changes in money growth precede changes in output doesn’t mean that the money changes cause the output changes b. Example: People put storm windows on their houses before winter, but it’s the coming winter that causes the storm windows to go on, the storm windows don’t cause winter c. Reverse causation means money growth is higher because people expect higher output in the future; the higher money growth doesn’t cause the higher future output d. If so, money can be procyclical and leading even though money is neutral
Money in the Classical Model B) Monetary nonneutrality and reverse causation (cont.) 3. Why would higher future output cause people to increase money demand? a. Firms, anticipating higher sales, would need more money for transactions to pay for materials and workers b. The Fed would respond to the higher demand for money by increasing money supply; otherwise, the price level would decline
Money in the Classical Model C) The nonneutrality of money: Additional evidence 1. Friedman and Schwartz have extensively documented that often monetary changes have had an independent origin; they weren’t just a reflection of changes or future changes in economic activity a. These independent changes in money supply were followed by changes in income and prices b. The independent origins of money changes include such things as gold discoveries, changes in monetary institutions, and changes in the leadership of the Fed
Money in the Classical Model C) The nonneutrality of money: Additional evidence (cont.) 2. More recently, Romer and Romer documented additional episodes of monetary nonneutrality since 1960 a. One example is the Fed’s tight money policy begun in 1979 that was followed by a minor recession in 1980 and a deeper one in 1981 b. That was followed by monetary expansion in 1982 that led to an economic boom 3. So money does not appear to be neutral 4. There is a version of the classical model in which money isn’t neutral—the misperceptions theory discussed next
The Misperceptions Theory and the Nonneutrality of Money A) Introduction to the misperceptions theory 1. In the “basic” classical model, money is neutral since prices adjust quickly a. In this case, the only relevant supply curve is the long- run aggregate supply curve b. So movements in aggregate demand have no effect on output 2. But if producers misperceive the aggregate price level, then the relevant aggregate supply curve in the short run isn’t vertical a. This happens because producers have imperfect information about the general price level b. As a result, they misinterpret changes in the general price level as changes in relative prices c. This leads to a short-run aggregate supply curve that isn’t vertical d. But prices still adjust rapidly
The Misperceptions Theory and the Nonneutrality of Money B) The misperceptions theory is that the aggregate quantity of output supplied rises above the full-employment level when the aggregate price level P is higher than expected 1. This makes the AS curve slope upward 2. Example: A bakery that makes bread a. The price of bread is the baker’s nominal wage; the price of bread relative to the general price level is the baker’s real wage b. If the relative price of bread rises, the baker may work more and produce more bread c. If the baker can’t observe the general price level as easily as the price of bread, he or she must estimate the relative price of bread d. If the price of bread rises 5% and the baker thinks inflation is 5%, there’s no change in the relative price of bread, so there’s no change in the baker’s labor supply e. But suppose the baker expects the general price level to rise by 5%, but sees the price of bread rising by 8%; then the baker will work more in response to the wage increase
The Misperceptions Theory and the Nonneutrality of Money B) The misperceptions theory is… (cont.) 3. Generalizing this example, if everyone expects prices to increase 5% but they actually increase 8%, they’ll work more 4. So an increase in the price level that is higher than expected induces people to work more and thus increases the economy’s output 5. Similarly, an increase in the price level that is lower than expected reduces output 6. The equation Y = + b(P – Pe) [Eq. (10.4)] summarizes the misperceptions theory 7. In the short run, the aggregate supply (SRAS) curve slopes upward and intersects the long-run aggregate supply (LRAS) curve at P = Pe
Figure 10.6The aggregate supply curve in the misperceptions theory
“Extended” Classical Model • Misperceptions theory • Positive slope in the SRAS • Money is NOT NEUTRAL in the short-run • Real effects of demand-side shocks such as fiscal or monetary stimulus • Money is NEUTRAL in the long-run because expectations on the price level are taken correctly (misperceptions are eliminated)