Download

1 / 21
210 likes | 269 Vues
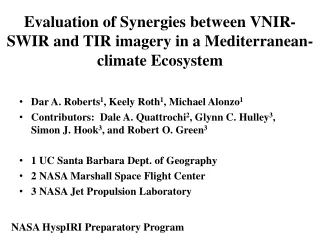
Evaluation of Synergies between VNIR-SWIR and TIR imagery in a Mediterranean-climate Ecosystem. Dar A. Roberts 1 , Keely Roth 1 , Michael Alonzo 1 Contributors: Dale A. Quattrochi 2 , Glynn C. Hulley 3 , Simon J. Hook 3 , and Robert O. Green 3 1 UC Santa Barbara Dept. of Geography

E N D
Evaluation of Synergies between VNIR-SWIR and TIR imagery in a Mediterranean-climate Ecosystem • Dar A. Roberts1, Keely Roth1, Michael Alonzo1 • Contributors: Dale A. Quattrochi2, Glynn C. Hulley3, Simon J. Hook3, and Robert O. Green3 • 1 UC Santa Barbara Dept. of Geography • 2 NASA Marshall Space Flight Center • 3 NASA Jet Propulsion Laboratory NASA HyspIRI Preparatory Program
Research Questions • What is the potential for improved temperature emissivity separation (TES) using VNIR-SWIR column water vapor? • What is the relationship between moisture content and emissivity? • What is the relationship between common hyperspectral measures of plant stress and physiological function (i.e., PRI, leaf water content) and canopy temperature in imagery and observed in ground-based measurements? • How does canopy temperature vary as a function of plant functional type (PFT) and species at native and HyspIRI spatial scales? • How is canopy temperature and emissivity impacted by changes in canopy cover, notably changes in green vegetation (GV) fraction, non-photosynthetic vegetation (NPV) and bare soil? How is temperature partitioned among the various components of cover?
General Approach • AVIRIS Analysis • Reflectance Retrieval with 7.5, 15 and 60 m radiance data • Reflectance, retrieval products (water vapor, liquid water) • Cover Fractions and Species/PFT identification • Multiple Endmember Spectral Mixture Analysis • Fused field and AVIRIS-derived spectral library (7.5 m) • Iterative Endmember Selection, cover class (i.e., bark, composite shingle, oak), species • Multi-level fusion (2, 3, 4 em models, selected based on an RMS threshold) • AVIRIS water content, hyperspectral stress indices (PRI) • MASTER Analysis • Atmospheric correction • Modtran simulated, AVIRIS column water vapor • Temperature Emissivity Separation (TES): • TES, using ASTER algorithm (Gillespie et al.) • Combined analysis of image pairs • Full spectral analysis (VSWIR-TIR) of plant materials seasonally
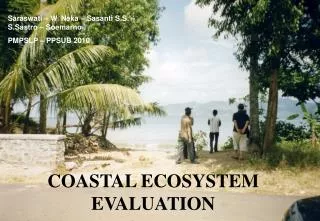
Santa Barbara Study Site • Pre-fire • August 6, 2004 (16 m) • August 6-12, 2007 (4 m): urban • June 19, 2008: AVIRIS-MASTER Pair • Post-fire • March 10, 2009 (post Gap & Tea, pre-Jesusita) • March 31, 2009 (post Gap & Tea, pre-Jesusita) • May 8, 2009 (Active Jesusita) • June 17, 2009 • August 26, 2009 • April 30, 2010 • October 26, Nov 1, 2010 • July 19, 2011: AVIRIS-MASTER Pair True Color: August 6, 2004
AVIRIS Species and Plant Functional Types • Existing, accurate maps of species, PFT generated using MESMA and Iterative Endmember Selection • Existing network of species polygons • Existing reference spectral library of natural and anthropogenic materials
Synergies between VNIR-SWIR and TIR in an urban Environment: RSE, in press • Mixed urban-natural systems, ~ 150,000 people • AVIRIS-MASTER pair, June 19, 2008 • 7.5 m AVIRIS, 15 m MASTER • Spatial degradation, 15 m AVIRIS, 60 m AVIRIS/MASTER
Methods • Preprocessing • AVIRIS-MASTER georectified to high resolution DOQQ • AVIRIS Analysis • ACORN 5, applied to 7.5, 15 and 60 m radiance data • Reflectance, water vapor, liquid water, albedo (Modo 4.3 Irradiance) • Surface Composition • VIS Model (Vegetation, Impervious, Soil expanded to include NPV) • Multiple Endmember Spectral Mixture Analysis • Fused field and AVIRIS-derived spectral library (7.5 m) • Count-based Endmember Selection, cover class (i.e., bark, composite shingle, oak) • Multi-level fusion (2, 3, 4 em models, selected based on 0.007 RMS threshold) • Water screened by LST (< 297.15K) • MASTER Analysis (Hulley and Hook) • Temperature Emissivity Separation (TES) • Modtran 5.2 derived atmospheric correction • NCEP column water vapor, iteratively adjusted for water over Laguna Blanca • TES, using ASTER algorithm (Gillespie et al.) • Spectral emissivity, broad band emissivity, LST
Land-Cover Analysis/Mixture Validation(Quattrochi and Roberts) • Defined 14 dominant land-cover classes on Google Earth Imagery • Residential (high, medium, low), Commercial, Transportation, Roofs • Closed canopy forest, Forested park, Golf courses, Grass sports fields, Orchards, Annual crop • Bare soil, crop • Extracted GV, NPV, Impervious, Soil fractions and land surface energy properties • Developed Mixture Validation Data Sets from NAIP • 120x120 m polygons (ranges in surface fractions) • Large, mixed land-cover polygons
Mixture Validation • Utilized 85 polygons • 64 land-cover • 21 designed • Calculated fractions from high-res imagery • Manually delineated polygons for GV, NPV, Soil and Impervious • Determination aided by AVIRIS A C B Figure showing three validation polygons A: 44% NPV, 11.3% GV,44.7% Soil B: 50.45%NPV, 1.5% GV,48%Soil C: 4.8% NPV, 57.4% GV, 34.5% Soil, 3.3% Imp
ResultsAVIRIS-MASTER Products • Fine spatial scale variability in water vapor • Elevation gradients clear • AVIRIS 1.2 – 1.7 cm, MASTER 0.78 cm • Liquid water and emissivity positively correlated • Asphalt also high emissiivty • Albedo and LST poorly correlated
Reflectance and Emissivity Spectra • Biotic Materials – Most Distinct in VSWIR (all unique) • NPV low emissivity in TIR (Differs by stature) • Abiotic Materials – Varies • AVIRIS: Painted roofs, red tile • Soils and some road surfaces are not distinct* • MASTER: Quartz beach sands, various roof types • Asphalt surfaces are near black bodies VSWIR-TIR improves discrimination of abiotic materials
MESMA: Endmember Selections • Selected 41 non-water endmembers • 4 NPV, 8 GV, 9 soils, 20 Impervious • GV strictly AVIRIS, transportation field, roofs, soils, NPV mixed
VIS-NPV Fractions: 15 and 60 m • GV and NPV fractions scaled well between all spatial resolutions • 7.5, 15 and 60 m • Soil tended to be overmapped at the expense of Impervious at coarser scales Two error sources Asphalt – soil Red Tile Roof (so variable requires 3 ems)
Fraction Validation: 15 m a) GV b) NPV Phenology c) Impervious d) Soil Under- mapped Soil Overmapped (red tile/Asphalt)
Fraction Validation: 60 m a) GV b) NPV GV-NPV Fractions good at HyspIRI scales c) Impervious d) Soil
Land-cover Composition • Cover fractions follow the expected pattern • High GV, low Temperature • High Impervious, high Temperature • Residential • Low density, high GV, Low T, low Imp • High density, low GV, High T, High Imp 306K 325K
Green Cover and LST • Standard inverse relationship between GV Cover and LST • Considerable scatter • The scatter is likely to be the most interesting part • Moist soils evapotranspiring • Closed canopies with variable ET
What’s Next? • TES with AVIRIS derived column water vapor • Spatial variation in LST in closed canopies • VSWIR stress measures • Analysis of new AVIRIS-MASTER pair, 2011 • Greater areal coverage, including greater elevation range, Gap, Tea and Jesusita Fire scars and a wide diversity of natural vegetation • Seasonal VSWIR-TIR spectroscopy • JPL Perkin Elmer, ASD and Nicolet • 17 tree species, chlorophyll, water • First measures late July 2011 • Follow up, Nov/Dec 2011, Mar 2012, June 2012 Source: Mike Alonzo, Keely Roth
Example VSWIR-TIR Spectra Quercus agrifolia Coast Live Oak Magnolia grandiflora Southern Magnolia Ceanothus spinosus Green bark Ceanothus Metrosideros excelsa New Zealand Christmas Tree Each plot shows the concatenated Perkin Elmer (VNIR-SWIR) and Nicolet (TIR) spectra for two samples.