Download
1 / 10
100 likes | 178 Vues
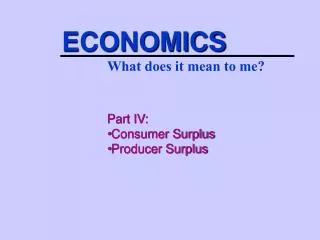
Understand Total Possible Revenue and Consumer Surplus concepts with numeric examples and integration methods for revenue calculations.

E N D
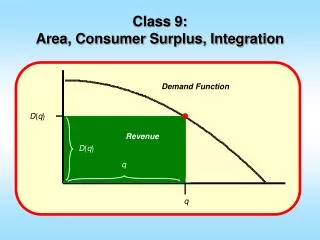
Demand Function D(q) Revenue D(q) q q Class 9: Area, Consumer Surplus, Integration
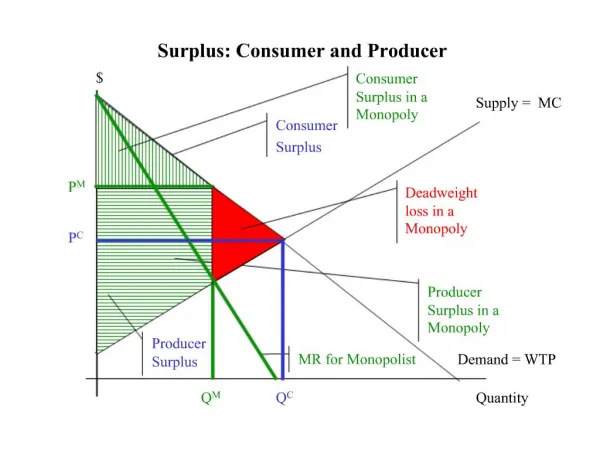
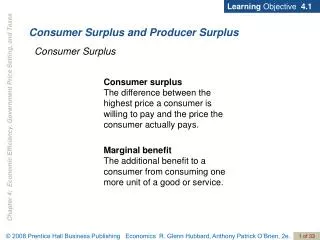
Demand Function Total Possible Revenue What is Total Possible Revenue? The total possible revenue is the money that the producer would receive if everyone who wanted the good, bought it at the maximum price that he or she was willing to pay.
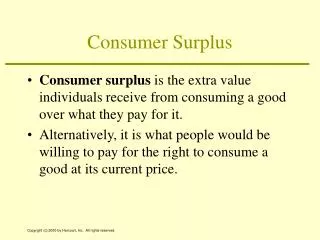
Demand Function Consumer Surplus D(q) Revenue Not Sold q Consumer Surplus The total extra amount of money that people who bought the good would have been willing to pay is called the consumer surplus.
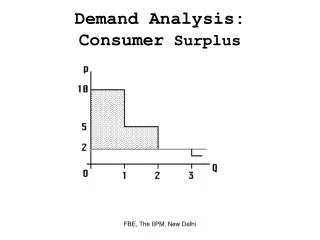
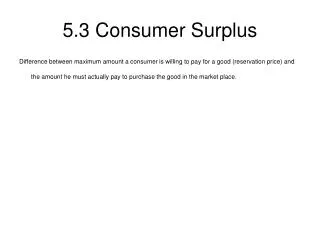
Finding Areas What is the area of the region R that is enclosed between the x-axis and the graph of f(x) = 2x x2/2, for x between 1 and 4?
Finding Areas What is the area of the region R that is enclosed between the x-axis and the graph of f(x) = 2x x2/2, for x between 1 and 4?
For n = 6 rectangles Sum of areas called S6 = f(m1)x + f(m2)x + f(m3)x + f(m4)x + f(m5)x + f(m6)x = 4.531250.
More rectangles: Larger n As n increases, the value of Sn increases, getting closer and closer to the true are under the curve.
Integral Notation We write the value of the midpoint sum as n gets very large by an integral
$32 D(q) = 0.0000018q2 0.0002953q + 30.19 Consumer Surplus $24 $19.99 Demand Function q = 2,300 $16 D(2,300) = $19.99 Not Sold $8 Revenue $45,977 $0 0 1000 2000 3000 4000 5000 2,300 Find Revenue from Buffalo Dinners Not Sold:Optimum price and quantity are $19.19 and 2300 4014
$32 D(q) = 0.0000018q2 0.0002953q + 30.19 Consumer Surplus $24 $19.99 Demand Function q = 2,300 $16 D(2,300) = $19.99 Not Sold $8 Revenue $45,977 $0 0 1000 2000 3000 4000 5000 2,300 Find Consumer Surplus for Dinners