Download
1 / 7
70 likes | 176 Vues
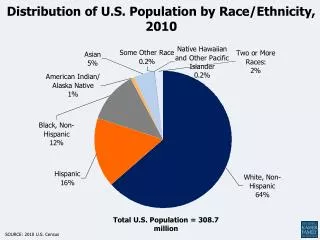
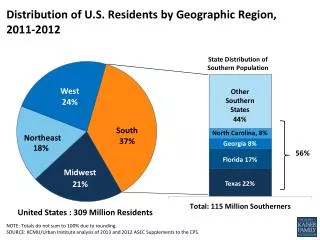
Distribution of U.S. Residents by Geographic Region, 2011-2012. State Distribution of Southern Population. Other Southern States. North Carolina, 8%. Northeast. Georgia 8%. 56%. Florida 17%. Midwest. Texas 22%. United States : 309 Million Residents.

E N D
Distribution of U.S. Residents by Geographic Region, 2011-2012 State Distribution of Southern Population Other Southern States North Carolina, 8% Northeast Georgia 8% 56% Florida 17% Midwest Texas 22% United States : 309 Million Residents NOTE: Totals do not sum to 100% due to rounding. SOURCE: KCMU/Urban Institute analysis of 2013 and 2012 ASEC Supplements to the CPS.
Health Insurance Coverage of the Nonelderly Population, by Geographic Region, 2011-2012 Health Insurance Coverage of the Nonelderly Population, by Geographic Region, 2011-2012 47.0 M 56.6 M 63.7 M 99.3 M NOTE: *The difference between this region and the South is significantly different at the 0.05 level for this percentage SOURCE: KCMU/Urban Institute analysis of 2013 and 2012 ASEC Supplements to the CPS.
Poverty Rates Among Nonelderly Southerners, by State, 2011-2012 United States: 21% South: 22% SOURCE: KCMU/Urban Institute analysis of 2013 and 2012 ASEC Supplements to the CPS.
Status of Medicaid Expansion Decisions in the South as of April 2014 DE MD WV VA DC KY NC TN SC OK AR GA AL MS LA TX FL Implementing the Medicaid Expansion in 2014 (6 States, including DC) Not Moving Forward at this Time (11 States) SOURCES: State decisions on the Medicaid expansion as of April 2014. Based on data from the Centers for Medicare and Medicaid Services, available at: http://medicaid.gov/AffordableCareAct/Medicaid-Moving-Forward-2014/Medicaid-and-CHIP-Eligibility-Levels/medicaid-chip-eligibility-levels.htmlwith state updates.
Median Medicaid/CHIP Eligibility Limits as a Percent of the Federal Poverty Level, by Population Group and Geographic Region, January 2014 NOTE: Eligibility limits are for parents in a family of three and for individual adults. Limits include the standard five percentage point of FPL disregard. SOURCE: Based on data from the Centers for Medicare and Medicaid Services at Medicaid.gov
Regional Distribution of Uninsured Adults in the Coverage Gap, 2014 South 79% (3.8 Million) Total: 4.8 Million Adults in the Coverage Gap NOTE: Excludes undocumented immigrants. Totals may not sum due to rounding. SOURCE: Kaiser Family Foundation analysis based on 2014 Medicaid eligibility levels and 2012-2013 Current Population Survey.
Share of Nonelderly Uninsured Adults Who Would be Eligible for the Medicaid Expansion but are in the Coverage Gap, by Race/Ethnicity, 2014 Nonelderly Uninsured Southern Adults Who Would be Eligible for the Medicaid Expansion (<138% FPL) 7.4 M 3.2 M 2.1 M 1.7 M 4.2 M NOTES: Excludes legal immigrants who have been in the country for five years or less and undocumented immigrants. SOURCE: Kaiser Family Foundation analysis based on 2014 Medicaid eligibility levels and 2012-2013 Current Population Survey.