Download
1 / 27
270 likes | 390 Vues
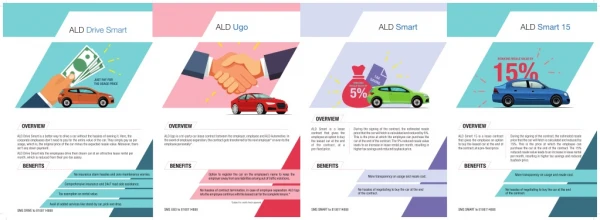
Driving the Risk Out of Public Fleet Management. Derived from a 2009 Congress presentation by Del Lisk VP, DriveCam Management dlisk@drivecam.com. Agenda. The flaw in most fleet safety programs Background on how a video technology based driver risk management program works

E N D
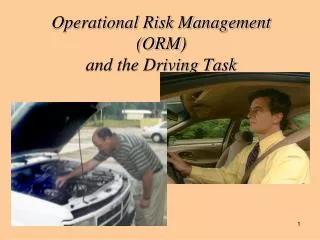
Driving the Risk Out of Public Fleet Management Derived from a 2009 Congress presentation by Del Lisk VP, DriveCam Management dlisk@drivecam.com
Agenda • The flaw in most fleet safety programs • Background on how a video technology based driver risk management program works • Why this approach can be a game changer • Examples of commonly identified risky behaviors • Case study from Orange County Florida
1 Major Injury or Fatality 29 Minor Injuries 300 Unsafe Behaviors Improving Fleet Safety • Most fleets safety efforts are based on lagging indicators • Use leading indicators to isolate & correct risky driving before it leads to a crash
Improving Fleet Safety Many fleets attempt to identify risk
Technology Enables the Program Video Event Recorders • Mount on windshield • Dual lens, captures forward and inside • Triggered by excessive forces • Erratic driving • Collisions • LED flashes when triggered • Digital looping memory captures before and after event • Stores “events” for later download • Typically downloads via cellular
How the Program Works Upload triggered event 2 1 3 Capture risky driving Review, analyze and score Driver Risk Management Program 6 Saferdriver returns tothe field 4 Access website for events, dashboards and reports This is where traditional training leaves off 5 Coach driver
Performance Management • Key program activities are monitored to insure application of process (potential failure points) • Downloading of events (system health) • Coaching execution • Driver assignment to events
Leading Indicators Monitored to Measure Program Effectiveness
Challenges • Funding • $ are tight and costs must be justified • Labor concerns based on misinformation & misconception • “Just a way to get me fired” • Usually no new policies • “Could embarrass me” • Secure, password protected website • Open communication is the key • “Big brother” • Actually only saves 2-3 minutes per driver per month • Organizational commitment to safety • You must now act on what you know !
Insights – Emphasize Active Eyes • Study of Intersection Crashes Found: • Only 22% involved subject driver running light • 73% never scanned • 56% of drivers had no eye activity for 10 seconds before crash • Traffic density, cell phones , distractions not a big factor
Case Study: Orange County Florida Information provided by: John Petrelli, Risk Manager
About Orange County, Florida • 1.2 million people in county • 8,000 employees • 2,000 vehicles ranging from solid waste to trucks to Ford Focus • $1,000,000 deductible (essentially self-insured) • Implemented video-based driver risk management program in 2008
Background on OC Fleet Safety Experience • Previously drivers attended the National Safety Council’s DDC course • But, auto liability losses were increasing annually. • Changed to an online training course • Losses stopped increasing but were flat lining • OC decided they needed a new approach to make progress • Looked to behavior-based safety approach & felt video was best
Case Study: Orange County, FL • 1st step was to conduct a pilot • 30 vehicle test with ½ heavy trucks and ½ small vehicles • Departments involved: • Police • Fire • Public Works • Utilities
Case Study: Orange County, FL • Initial pushback from unions (IAF,PBA,LIUNA) • Big brother concerns • Concerns over discipline • Met with shop stewards to explain the program • Common identified risky behaviors: • Failure to wear a seatbelt • Many were treating stop signs and red lights as an option
Case Study: Orange County, FL Pilot Results • Leading indicators showed risky driving had dropped by over 50% • Lagging indicators (collisions & claims) showed 90% reduction in frequency & severity for the pilot group
Case Study: Orange County, FL Selling it to “The Boss” (Getting funding) • Successful pilot program • Solid financial ROI • Projected 50% annual reduction in losses • 3.5 year payback • Protection against false claims • Reduction in at-risk behaviors & improved public image
Next Steps • Presented findings and recommendations to: • County Administrator • Mayor • County commissioners • Project was approved • Used “catastrophic losses” fund to pay for deployment of additional 500 vehicles • Fund is replenished annually
Current Results • Leading indicators are going down • 42% drop in risk points • 57% drop in risky events 3/16/2009 7/20/2009
Results • One year later • 530 vehicles enrolled in program • 250 more planned for 10/1/09 • For vehicles enrolled in program: • 60 % reduction in claims frequency • 55% reduction in severity • 74% cost reduction • Nearly $300K in savings
The best car safety device is a rear-view mirror with a cop in it. Dudley Moore