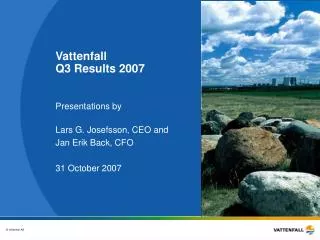
Vattenfall Perspective on Wind in Forest
Vattenfall Perspective on Wind in Forest. Jens Madsen Principal R&D Engineer, Ph.D Vattenfall Research & Development AB. Presentation Outline. Who are we? Short introduction to Vattenfall Why do we care about “wind in forest”? Our motivation What are we doing?

Vattenfall Perspective on Wind in Forest
E N D
Presentation Transcript
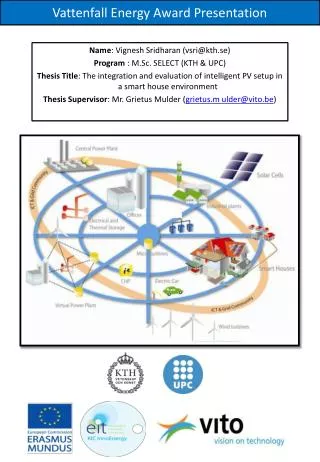
Vattenfall Perspective on Wind in Forest Jens Madsen Principal R&D Engineer, Ph.D Vattenfall Research & Development AB
Presentation Outline • Who are we? • Short introduction to Vattenfall • Why do we care about “wind in forest”? • Our motivation • What are we doing? • Overview of forest-related activities (measurements, CFD, …) • Where do we want to go? Acknowledgements: Adrien Corre, Jan-Åke Dahlberg, Rasmus Bernsdorff
Vattenfall AB at a glance The Vattenfall Group wholly owned by the Swedish State Europe’s 5th largest producer of electricity Europe’s largest producer of heat Key Figures Net sales: € 21,2 billion Electricity generation: 183.4TWh Wind power is only 1-2% Heat generation: 36,2TWh More than 43,000 employees Vattenfall Wind Power Largest Nordic generator of wind power World’s 2nd largest offshore wind owner/operator Onshore 530 MW Offshore 370 MW Production 2,2 TWh Wind Power Assets
Welcome to our world – it’s full of trees ! • Aggressive growth in wind power portfolio • Majority of onshore projects (Sweden, UK, Denmark) are in areas affected by forest • Sweden has 60-65% forest cover • About 18% of all forest in Europe • Forest coverage in comparison: • Denmark: 11% • United Kingdom: 12% (Scotland 15%) • Germany: 31% • European average: 35-45% • Need to understand wind conditions in forest • 35 met masts and 20 SODAR systems in operation (mostly in southern Sweden) • High turbulence and wind shear confirmed • A matter of techno-economical risk mitigation
Foto: Hans Blomberg Ryningsnäs – Forest Test Site Improve knowledge on wind power in forest • Wind measurements using SODAR and met mast (96m, 5booms / 140m, 7 booms) • Two Nordex turbines (2.5MW) with hub heights 80m and 100m
Ryningsnäs Foto: Hans Blomberg
Ryningsnäs – wind resources • Site wind resources much poorer than expected • 6m/s mean wind speed (measured @ 100m-agl / 88m over zero plane) • MIUU windmapping of Sweden (meso-scale) predicted 7.2m/s • Translates to an AEP of 7TWh, much lower than expected 12TWh • The 100m hub WT produces 35% more than the 80m hub turbine
Ryningsnäs – Wind Shear & Turbulence • Large wind shear observed (up to: α = 0.6) • High turbulence levels (typically TI=20..25% at hub height)
Wind Shear – seen with the naked eye 120-meter mast at Vattenfall site in Southern Sweden
Ryningsnäs – Load variations in blade root • Clear advantages of higher hub heights • Higher energy production • Lower turbulence • Less variations in WT loads
CFD school Porous zone with drag resistance Turbulence modulation Applies first principles Forest Canopy Models • WAsP school • Increase roughness class • Add zero-plane displacement • Applies empirical information
CFD Forest Test Model U*=0.58 K=0.42 (Von Karman constant) Z0=0.005 Inlet profile: TKE inlet: Dissipation rate inlet: With: Where: k − ε constant:
Uniform Sitka Spruce Pine Forest Forest Characterization Could Matter … Dalpé & Masson, EWEC-2007
Two cases considered • CASE 1 • Comparison forest constant resistance with LAI = 4.2 vs forest with LAI = 8.6 • Determine the impact of forest density. • CASE 2 • Comparison forest constant resistance forest (LAI = 2.03) vs profiled resistance with LAI = 2.03 (jack pine forest) • Investigate impact of forest density profile.
Thoughts on CFD canopy modeling • The idealized, homogeneous forest does not exist • What is the impact of a heterogeneous forest layout? • Main difference in canopy model flow predictions in zones with changes in roughness and density • Conclusion • Canopy models are sufficiently good … • … considering the poor parameters we feed into them • Spatial distribution of forest height and density • From a practical standpoint, there is no sense in continuing to tweak models until better inputs become available • Implement advanced forest characterization techniques
LIDAR Airborne Forest Imaging • Technology used in Forest Inventory Management • Laser beam is reflected either by canopy or ground • Scans 500-800 meter wide section per flight leg • 10 cm accuracy (height) • Data provided • Digital Terrain Model (DTM) • Forest parameters • Mean tree height (± 5%) • Density parameters (such as LAI) • Detailed input for CFD forest canopy models
Final remarks • Other activities • Forest model validation studies • Noise dispersion in the forest • Validation of Nord2000 model • Wake effects in forest • How does the severe wind shear and turbulence impact wake dynamics Thanks for listening !!