Download

1 / 10
100 likes | 119 Vues
This chapter covers the Goodness-of-Fit test, explaining how well a model fits given data using the chi-squared distribution. It discusses testing for continuous distributions, estimating parameters, and provides examples for both continuous and discrete distributions.

E N D
Chapter 14 Goodness-of-Fit Tests
Goodness-of-Fit StatisticMeasure of how well a model explains a given set of data.
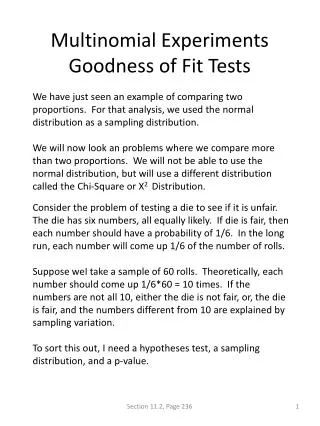
Multinomial Experiment Provided that npi 5 for every i, the random variable has approximately a chi-squared distribution with k – 1 df.
When the Underlying Distribution is Continuous Let X denote the variable being sampled. The hypothesized pdf is f0(x). Subdivide the measurement scale of X into k intervals [a0, a1),…, [ak, ak-1). The cell properties specified by H0 are
Degrees of Freedom A general rule of thumb for degrees of freedom in a chi-squared test is:
Goodness of Fit for Continuous Distributions The chi-squared test can be used to test whether the sample comes from a specified family of continuous distributions. Once the cells are chosen (independent of the observations) it is usually difficult to estimate unspecified parameters from the observed cell counts, so mle’s based on the full sample are computed.
Example of Goodness-of-Fit TestYou are testing a power supply used in a computer. Using α = .05, determine whether output voltage is adequately described by a normal distribution. From the sample data below, you obtain sample estimates of the mean and standard deviation.ẍ = 5.04 volts and s = 0.08 volts k = 8Class Interval Observed Expected x < 4.948 12 12.54.948 ≤ x < 4.986 14 12.54.986 ≤ x < 5.014 12 12.55.014 ≤ x < 5.040 13 12.55.040 ≤ x < 5.066 12 12.55.066 ≤ x < 5.094 11 12.55.094 ≤ x < 5.132 12 12.55.132 ≤ x 14 12.5
Goodness of Fit for Discrete Distributions Let be the maximum likelihood estimators of based on the full sample X1,…,Xn and let denote the statistic based on these estimators. Then the critical value that specifies a level upper-tailed test satisfies
Example for Discrete RVThe number of defects in printed circuit boards is hypothesized to follow a Poisson pmf. A random sample of n = 60 boards has been collected. The following data result:Number of defects Observed 0 32 1 15 2 9 3 4