Download
1 / 27
270 likes | 302 Vues
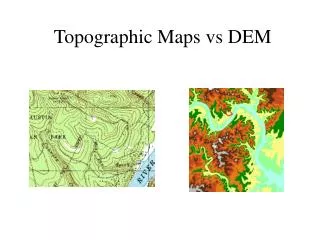
Earth Science – Unit 1.1 Reading Topographic Maps. Topographic Maps Outline. - Definition - Features - Elements - Contour lines - Cross-section representation - Exercise. Definition of Topographic Maps. 1. A graphical representation of the three dimensional shape of the earth’s surface.

E N D
Earth Science – Unit 1.1 Reading Topographic Maps
Topographic Maps Outline - Definition - Features - Elements - Contour lines - Cross-section representation - Exercise
Definition of Topographic Maps 1. A graphical representation of the three dimensional shape of the earth’s surface. 2. A reduced, simplified, categorized/classified, symbolized and annotated representation of the earth’s surface which has been projected on a horizontal plane.
Features of Topographic Maps TOPOGRAPHY (RELIEF): - printed in brown - contour lines shows hills, mountains, plains, etc. WATER FEATURES: - printed in blue - includes oceans, lakes, ponds, rivers, canals, etc. CULTURE: - printed in black - human-make works such as roads, railroads, buildings, land boundaries, etc.
Features of Topographic Maps Relationship between 3D and 2D representation 3D view 2D view
Title and Location MAP TITLE
Title and Location QUADRANGLE LOCATION
Map design Other Information
Earth's Surface Location Coordinates Position on the surface of a sphere is most easily described by angle from the pole (N-S position), and from some defined 'prime meridian' (E-W position). These are usually given as: - parallels - latitude (angle from equator) - meridians -longitude (angle from Greenwich, England) So: Latitudes are a family of lines drawn on the globe parallel to the equator. Longitudes are circles drawn on the globe that pass through the two poles.
Latitude and Longitude Generalized system of meridians and parallels
Projection DEFINITION The process of constructing a map, the transferring of the meridians and parallels to a flat sheet of paper. The resulting product of this geometric exercise is called a 'map projection'. This can be done in a wide variety of ways, the principle differences being projections that show accurate area over the entire map, and those that show accurate distance.
Type of Projections Transformation from lat/long to a flat surface
Projections: Equal Distance vs. Area Equal Area Cylindrical Equidistant Cylindrical
Orthographic Projection: Orbital View Othographical
UTM – Universal Transverse Mercator • Cylindrical (transverse) • Conformal • Scale is true along Central Meridian • Used extensively for quadrangle maps at scales of 24,000 from 250,000 • 60 zones, 6 degrees each.
Map Scale Definition A means of showing the relationship between the size of an object or feature indicated on a map and the actual size of the object on the ground. Scale is expressed as a ratio, such as 1:24,000 (i.e. 1 unit on the map equal 24,000 units on the ground) and shown graphically by Scale bars marked in feet and miles or meters and kilometers.
1 0 1 2 3 4 Miles Scale Types Fractional scale: - is a fixed ratio between linear measurements on the map and corresponding distances on the ground. It is sometimes called the representative fractionor R.F. Example: R.F. 1:62,500 Graphical scale: - is simply a line or bar drawn on the map and divided into units that represent ground distances. Example: Verbal scale: - is a convenient way of stating the relationship of map distance to ground distance. Example: 1 inch equals 1 mile
Scale Decreasing Detail Increasing Coverage 1:24,000 scale 1:100,000 scale 1:125,000 scale
Declination True North (Through the Poles) Magnetic North
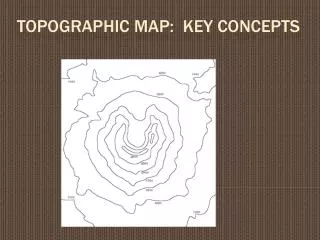
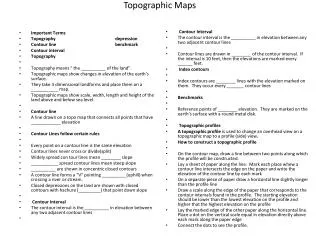
Contour lines DEFINITION A contour line is an imaginary line on the surface of the earth connecting points of equal elevation. Topography is the configuration of the land surface and is shown by means of contour lines. The contour interval (C.I.) is the difference in elevation between any two adjacent contour lines.
Contour lines Relationship between topographic features and contour lines
General Features of Contour Lines - contour lines connect points of equal elevation - steep slopes are shown by closely spaced contour lines - gentle slopes are shown by widely spaced contour lines • contour lines do not intersect, branch or cross, except in a vertical or overhanging cliff. - when contour lines cross streams they bend upstream; that is, the contour line forms a 'V' with the apex at the intersection with the stream, and pointing in an upstream direction. - closed contours appearing on the map as ellipses or circles represent hills or knobs. - closed contours with hatchures, short lines pointing toward the center of the closure represent closed depressions.
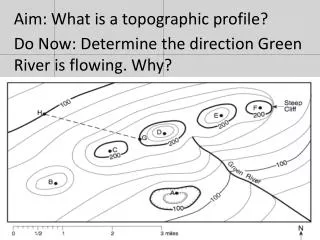
Topographic Profiles DEFINITION - A topographic profile is a diagram that shows the change in elevation of the land surface along any given line. - It graphically represents the 'skyline' as viewed from a distance.
Topographic Profile Constructing a Topographic Profile