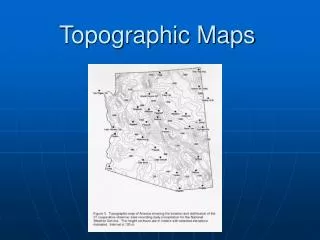
Who uses topographic maps?
Who uses topographic maps?. the military. miners. police. farmers. When might someone use a topographic map?. building homes. plan a hiking trip. landscaping. road building. Topographic Map. illustrates the relief (high & lows) of the Earth’s surface

Who uses topographic maps?
E N D
Presentation Transcript
Who uses topographic maps? the military miners police farmers
When might someone use a topographic map? building homes plan a hiking trip landscaping road building
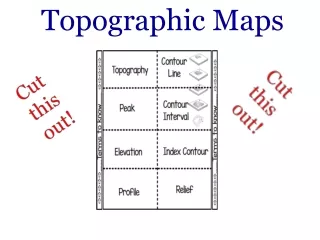
Topographic Map • illustrates the relief (high & lows) of the Earth’s surface • USGS (United States Geological Survey) produces topographic maps
Map Scale • Shows the relationship between distance on the map and distance on the actual land. All good maps should have a scale • 1:24000 • 1 inch (on the map) = 24000 inches (on land) • 1 foot (on the map) = 24000 feet (on land
Contour lines • lines drawn to connect points at the same elevation • These lines help you visualize the shape of the land & its features, including the steepness of slopes, depressions, etc.
Contour Interval • The difference in elevation between 2 consecutive contour lines • The interval will vary from map to map • REMEMBER!!! The contour interval measures the difference in HEIGHT, not the distance along the ground
Index Contour Lines Every 5th line is bold and labeled with elevation
Rule of V’s V- shaped contour lines indicate valleys The V points toward the higher end of the valley. When contours cross water they form a V. The V always points upstream. So water flows in the opposite direction that the V is pointing. http://regentsprep.org/regents/earthsci/units/mapping/topogr5.gif
If the contour interval is 50 meters, what is the elevation at point C? A B D C 250
Contour Interval? 20 Elevation of "A"? 540 Elevation of "B"? 580
If the contour interval is 50 meters, what is the highest possible elevation of point D? A B D C 349
Steep or Gentle? • Contour lines that are spaced close together indicate a steep slope • Contour lines that are spaced far apart indicate a gentle slope Gentle Steep
Benchmark • A location where exact elevation is known • Map Symbols = X or BM or Δ
Depression Contours • A lower area – like a sinkhole or crater – on a topographic map • The contour lines have hachures – like teeth
When determining the elevation of depression contours, the hachured contour has the same elevation as the contour line before it.
Magnetic Declinationa special “compass rose” • Geo-magnetic poles are different from geographic poles and must be accounted for when using a compass. • North end of a compass needle points in direction of geomagnetic north pole • Magnetic declination- angle between direction of geographic pole and direction in which the compass needle points
What are the steps to draw a topographic profile place a piece of paper between the points mark where every contour line touches the edge of the paper (or every index contour line) determine the elevation of each mark place the paper on the graph and mark the elevation of each contour line
Using the map and chart below, construct a topographic map profile.
Which profile best represents the contour map along the line AB?
Please match the contour map on the left with the profile on the right.
The elevation of Albany is 282 feet. The elevation at Binghamton is 1634 feet. The distance between the two cities is 115 miles. Calculate the gradient to the nearest tenthof a ft/mi. Show all work. gradient = change in elevation distance = 1634ft-282ft 115 miles = 1352 ft 115 miles = 11.8 ft/mile
The elevation of Watertown is 99m. The elevation at Oswego is 144m. The distance between the two cities is 75 km. Calculate the gradient to the nearest tenthof a m/km. Show all work. gradient = change in elevation distance = 144m – 99m 75 km = 45 m 75 km = 0.6 m/km