Download
1 / 23
230 likes | 262 Vues
Explore the progress and challenges in the financial systems of China and India, highlighting opportunities for reform to enhance efficiency and economic growth. This report delves into key findings and implications for policymakers.

E N D
The Value of Financial System Reform in China and India Diana Farrell, Director McKinsey Global Institute January, 2007
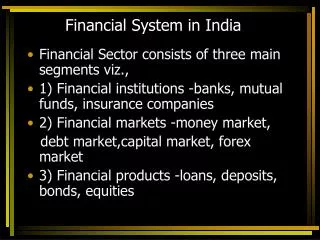
AGENDA • China’s Financial System • India’s Financial System
CHINA FINDINGS • China has made steady advances in modernizing its financial system and in mobilizing savings, reflected in the doubling of China’s stock of financial assets relative to GDP over the past ten years. China’s banking sector plays an unusually large role in its financial system. • Capital allocation in the system is poor: wholly and partially state-owned companies continue to absorb most of the funding from the financial system, while private enterprise, the engine of China’s growth, receives a disproportionately small share. As a result, China’s investment efficiency is declining. • The dominant bank sector, though improving, remains highly inefficient and potentially vulnerable. • Reforms that enable a larger share of funding to go to the most productive companies and improved the operating efficiency of financial system components would raise GDP by $321 billion annually, or 17 percent. • China’s financial system’s remaining problems are intricately linked across its component markets, and will therefore require an integrated approach to reform.
CHINA’S FINANCIAL SYSTEM DEPTH IS HIGH GIVEN ITS GDP PER CAPITA • Position in 2004 • 1994-2004 evolution for select countries • Stock of bank deposits, bonds and equity, 2004 • Percent of GDP • Mature Japan Malaysia United States United Kingdom Singapore South Africa Australia Sweden • Emerging Canada China South Korea Chile Taiwan Thailand • Nascent Finland India Saudi Arabia Norway Brazil Egypt New Zealand Turkey Czech Republic Hungary Philippines Mexico Russian Federation Indonesia Tunisia Vietnam United Arab Emirates Ukraine • GDP per capita (at purchasing power parity), 2004 • US $, logarithmic scale Note: China’s depth would be at 220% of GDP in 2004 according to recent GDP restatement. It is unclear how new GDP calculation methodology would affect China’s 1994 GDP. Source: WEFA; BIS; FIBV; WDI; IMF; GFS; McKinsey Global Institute analysis.
Equity • Corporate debt • Government debt • Bank deposits CHINA’S FINANCIAL SYSTEM IS DOMINATED BY THE BANKING SECTOR 2004 financial stock components Percent, US $ billion • 100% = 4,291 247 350 1,105 130 675 19,627 1,602 1,428 396 471 214 47,729 • India • Chile • China • Japan • Mexico • Thailand • Malaysia • Indonesia • Singapore • Philippines • Hong Kong • South Korea • United States • CAGR21994–2004 • Percent 20.5 6.5 2.8 12.3 1.0 8.8 3.5 11.0 10.5 6.0 3.4 6.4 9.4 • Depth • GDP multiple Note: Numbers may not add to 100 percent due to rounding. 1 Reflects China’s recently restated GDP. 2 CAGR = compound annual growth rate. Source: McKinsey Global Institute Global Financial Stock Database
11 PRIVATE COMPANIES GET A DISPROPORTIONATELY SMALL SHARE OF LOANS • State-owned enterprises • Shareholding and collective enterprises Comparison of GDP and corporate bank loans outstanding, 2003 Percent • Private and foreign enterprises • State-owned enterprises1 • 23 • 35 • Shareholding enterprises2 • 19 • Collective enterprises3 • 6 • 27 • 11 • Private and foreign enterprises4 • 52 • 27 • GDP5 • Corporate loans outstanding6 1SOEs are defined as wholly state owned. 2 Most of the shareholding enterprises are partly state owned. Some are state controlled, some are not. 3 Collective enterprises are owned by the population. Many are run like private enterprises, but some are effectively controlled by local political interests. 4 Fully private enterprises include local privately owned enterprises, foreign joint ventures, and wholly owned foreign enterprises. 5 Breakdown of industrial value added by ownership type, 2003, as determined by the Organisation for Economic Co-operation and Development. 6 Total corporate and government bank lending, based on a survey on commercial bank new loans conducted in 2002 by the People’s Bank of China. This is the most recent publicly available data on lending by company type. In the absence of more recent data, we are making the assumption that new lending in 2002 reflects the stock of outstanding credit in 2004. A higher portion of new lending today may go to private companies, but we have no evidence of this. Source: OECD; PBOC; McKinsey Global Institute analysis
170 THE PRODUCTIVITY OF STATE-OWNED FIRMS IS HALF THAT OF PRIVATE COMPANIES • Average Total Factor Productivity (TFP) of large industrial firms • Direct state control led firms = 100 • x2 • Direct state control • 100 • State controlled and collectives (48% of companies) • Indirect state control, LP1 >50% • 146 • Indirect state control, other • 170 • Collective >50% • 216 • Private, LP1 >50% • 221 • Privately controlled (52% of companies) • Private, individual >50% • 208 • Private, non-mainland >50% • 192 • Private, other • 200 1 Legal person. Source: OECD (Dougherty and Herd, 2005); McKinsey Global Institute analysis
3.7 • 1991-1995 • 1996-2000 • 2001-2003 • 1995-2004* • 1961-1970 • 1981-1990 THE EFFICIENCY OF CHINA’S INVESTMENT IS DECLINING • Investment required to produce $1 additional GDP ** • Years • China • 3.3 • 4.6 • 4.9 • 4.1 • India • 3.5 • Japan • South Korea • 3.7 * Fiscal years, finishing in March of the following year ** This metric is known as the “incremental capital-output ratio” Source: World Bank 2004 World Development Indicators; PBOC, Reserve Bank of India, McKinsey Global Institute analysis
8.6 60 PERCENT OF NPL REDUCTION IS DUE TO TRANSFER OF BAD LOANS TO ASSET- MANAGEMENT COMPANIES • Source of NPL reduction for large state-owned commercial banks, 2001–2005 • Percent of loan balance • 31.1 • 12.4 • 8.6 • 10.1 • NPLs at the end of 2001 • NPLs transferred to asset- management companies1 • NPL resolution and dilution due to growth • NPLs at the end of 20052 1 A total of $150 M was transferred between 2001 and 2005, which represents 12.4 percent of the 2005 loan balance. 2 End of Q3. Source: CBRC; PBOC; McKinsey Global Institute analysis
WEAK BANK PERFORMANCE IN CHINA CREATES VULNERABILITIES • Key vulnerabilities • Root causes of weak performance • Renewed NPL build-up • Sharp reductions in liquidity and profitability, due to concentration of profits, from: • Foreign bank entry • Corporate bond market development • Real estate exposure • Weak governance and lack of commercial mindset • Operational weaknesses in lending and risk management • Decentralized structure with local autonomy
0.7 • 13.4 • 3.2 • 0.1 • 0.1 • 1.0 • 1.3 REFORMING CHINA’S FINANCIAL SYSTEM COULD BOOST GDP BY UP TO $321 BILLION ANNUALLY Potential benefits of financial reforms in China US $ billion • Indirect impact on growth • Direct impact on efficiency • 259 • 62 • 1 • 2 • 25 • Increased bank efficiency • Migration of more payments to electronic platforms • Increased market debt intermediation • Increased equity trading efficiency • Direct impacts of financial system reforms • Increased productivity due to better capital allocation • Elimination of informal lending • Percent of GDP Source: McKinsey Global Institute analysis
CHINA: AN INTEGRATED PROGRAM OF FINANCIAL REFORMS IS NEEDED Reforms to improve allocation of capital 1 Improve governance and increase competition in the banking sector 2 Change collateral requirements for small businesses to improve access to credit 3 Support development of an independent consumer credit bureau and a corporate rating agency 4 Deregulate the corporate bond market Reforms to balance the financial system 5 Deregulate bank interest rates ahead of current schedule 6 Spur growth of domestic institutional investors through deregulation 7 Create a more strategic relationship between HKSE and mainland equity markets 8 Change equity IPO process to allow private companies and SMEs to compete for funds Reforms to improve overall system efficiency 9 Accelerate improvements in the payments system 10 Further liberalize the capital account Source: McKinsey Global Institute analysis
AGENDA • China’s Financial System • India’s Financial System
INDIA FINDINGS • India’s financial system has lower depth than other fast-growing Asian economies, indicating a low level of financial intermediation in the economy. Although the lauded equity market is sizable and growing, the banking sector dominates but does not lend broadly and the corporate bond market is small. • An array of financial system policies direct capital allocation in India. As a result, the fast growing private sector gets little credit while the government in various forms absorbs the vast majority of the intermediated capital. • Moreover, the state-dominated banking sector features low competitive intensity and significant inefficiencies. • Reforms that enable a larger share of funding to go to the most productive companies and improve the operating efficiency of financial system components would raise GDP by up to $48 billion annually. • Further reforms (financial and economic) could raise India’s real GDP growth rate to 9.4% annually, on par with China.
56 • Equity • Corporate debt • Gov. debt • Bank deposits INDIA’S FINANCIAL DEPTH IS LOW COMPARED TO OTHER ASIAN NATIONS Financial depth, 2004 Financial assets as a percent of GDP • 420 • 400 • 371 • 259 • 235 • 214 • 146 • 13 • 20 • 160 • 151 • 44 • 42 • 11 • 96 • 24 • 2 • 187 • 26 • 34 • 51 • 145 • 3 • 120 • 119 • 20 • 97 • 78 • 68 • 55 • 44 • Indonesia • Philippines • India • Thailand • Korea • China • Singapore • Malaysia • Japan Source: McKinsey Global Institute Global Financial Stock Database
39 LESS THAN HALF OF COMMERCIAL CREDIT GOES TO INDIA’S PRIVATE SECTOR • Distribution of commercial credit* • $ Billion, percent • 100% = • 122 • 211 • Private corporate • discretionary • 30 • 35 • Private corporate • Priority lending** • 13 • 5 • Agriculture • Household • enterprises & • proprietorships • Public sector • enterprises • 1999 • 2004 * Gross bank credit excluding financial companies; Includes corporate bonds and private placements, loans and investments from the government to public sector enterprises. ** Estimate of lending to small corporations equals “other” priority sector lending outside of agriculture and SSI Source: CSO; RBI; MGI; Public Enterprise Survey
52 INDIAN FIRMS RELY HEAVILY ON RETAINED EARNINGS • Sources of funds raised • $ Billion; percent, 2000-05* • 100% = • 204 • 1916 • 40 • 562 • 89 • 91 • 100 • 393 • 2 • 2 • 3 • 3 • 4 • Equity • Debt • Internal funds • 78 • 72 • 63 • 59 • 55 • 55 • 47 • 42 • India • Japan • Indonesia • South Korea • Singapore • Malaysia • US • Hong Kong * Based on sample of 160 companies per country outside of US. Companies were ranked by gross sales, and 40 companies from each quartile were taken as the sample. US sample… Source: Bloomberg, MGI
INDIAN BANKS LEND A SMALL PORTION OF DEPOSITS Commercial bank loans outstanding Percent of deposits, 2004* • G7 average: 118** * United states is 2003 data (2004 unavailable) ** Straight average; excludes Luxembourg and Iceland for which data is unavailable Source: RBI; EIU; McKinsey analysis
7.0 INDIA’S GOVERNMENT AND STATE-OWNED COMPANIES CONSUME 70% OF SURPLUS SAVINGS Sources and uses of net savings Percent of GDP, average 1994-2004 • 1.2 • 3.2 • Household • net savings • to the • financial system • Net foreign capital • inflows • Private • corporate borrowing • Public • sector borrowing Source: CSO; McKinsey Global Institute
22 FINANCIAL REFORM IMPACT:$22 BILLION DIRECT, $26 BILLION INDIRECT • Increasing efficiency • Shift financing mix • Total impact • Direct impact of financial system reform • $ Billion, 2004 • Indirect impact • 21.8 • 25.5 • 2.3 • 0.3 • 5.1 • Improvedallocationof capital • 18.9 • 6.3 • 7.8 • Capturingmore savings • 6.6 • Improved banking efficiency to best practice • Fully implement electronic payment system • Migrate informal lending to • formal • banks • Reduce corporate • bond default rates to benchmark • Shift in • financing • mix from • bank loans to • bonds • Direct • impact • of financial • system • reform • Percent • of GDP • 3.5 • 1.1 • 0.9 • 0.7 • 0.1 • 3.2 • 0.3 Source: RBI; CSO; McKinsey Global Institute Analysis
FINANCIAL SYSTEM REFORM COULD BOOST GROWTH TO CHINESE LEVELS • Real GDP • $ Billion 2000 • CAGR • 2004-2014 • Baseline 9.4% • Efficient investment and financial market reform 6.5% CAGR 1999-2004 5.9% * Forecasts of investment rates from Oxford Economic Forecasting ** Efficient investment ICOR is the average rate implied if the public sector and households are as efficient as the private corporate sector between 1999-2004. See exhibit x.x and the technical appendix Source: CSO, RBI, OEF, MGI
INDIA’S REFORM AGENDA MUST ADDRESS ALL PROBLEMS TOGETHER Reforms to improve capital allocation Lift most priority lending requirements, asset allocation restrictions, and guaranteed deposit schemes 1 2 Reduce state ownership in the banking sector Strengthen corporate governance in public sector banks 3 4 Lift restrictions on foreign ownership in banks Spur development of the corporate bond market 5 Reforms to hasten development of financial intermediaries Deregulate the insurance industry 6 Ensure pension reforms are enacted without limitations 7 8 Continue reforms of mutual fund industry Reforms to capture more household savings 9 Introduce gold deposit scheme to capture value of gold expenditures Reforms to improve overall system efficiency 10 Faster development of electronic payment system Separate the regulatory and central bank functions of RBI 11 Lift remaining capital account controls 12 Source: McKinsey Global Institute analysis
www.mckinsey.com/mgi THANK YOU