Download
1 / 21
210 likes | 361 Vues
PAISA Project Tracking School Grants in Nalanda District. A Joint Study carried out by Accountability Initiative, NIPFP and ASER Centre. PAISA Project Overview. Basic Objective: How money is spent in CSS How allocations happen – Annual Work Plan How much is released by Centre and States

E N D
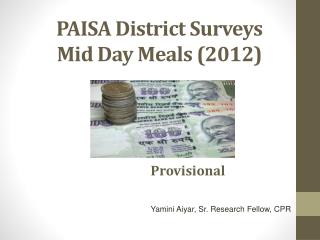
PAISA ProjectTracking School Grants in Nalanda District A Joint Study carried out by Accountability Initiative, NIPFP and ASER Centre
PAISA Project Overview • Basic Objective: How money is spent in CSS • How allocations happen – Annual Work Plan • How much is released by Centre and States • How much is spent by State societies • How money moves down the chain (Centre-State-District-Block-Service Provider) • How much reaches the delivery point and when • How much is spent and when • Can allocations, fund flow and expenditure be made more efficient
Nalanda Pilot Study • Sample of 100 schools • 50 randomly chosen schools from the whole district • Additional 50 which are nearest to the first 50 schools (“neighbourhood schools”) • Carried out on March 25 – 26, just before the end of the financial year • Questions relating to school infrastructure, enrolment, teachers, school grants and “one-lakh” question
School Infrastructure is old… Maintenance and repair expenditure will be significant in order to improve the quality of school infrastructure “Projected requirement of 3 lakh additional classrooms out of which only 61 thousand has been completed; SSA guidelines encouraged opening new schools rather than expanding existing ones” (State Project Director, Bihar)
PTR is over 40 in more than 90% of schools Significant increase expected in recurring expenditure on teacher salaries and training if PTR target of 40 is to be achieved. Bihar govt has appointed nearly 2 lakh new teachers. At the same time, 15 lakh out of school children have been brought into the school system
Upper Primary School Maghra Established: 1939 1400 Students; 16 Classrooms; 19 Teachers; New Primary School Kharjama Established: 2007 108 Students; 3 Classrooms; 2 Teachers;
School Infrastructure Teachers School Maintenance Classrooms: Rs 2,54,000 per additional classroom in UP and UPS both Repair: Rs 75,000 for major repair in both PS and UPS TLM: Rs 500 per teacher per annum in PS andUPS both School Development Grant (SDG): Rs 5,000 per year per PS and Rs 7,000 per year per UPS School Maintenance Grant (SMG):Rs 5,000 per year upto 3 classrooms; maximum of Rs 10,000 for more than 3 classrooms Furniture: Rs 500 per child as a one time grant only for UPS which started before 2001 Normative Grants under UEE Program
Annual Work Plan Approval of Allocation Release of Funds Expen-diture Spillover Following the money trail……. The first step is to unbundle the procedure of planning, allocation, release and expenditure of funds devolved through the scheme. The timeline of the respective activities is also critical – delay in drawing up the plan leads to delays in activities down the chain, and consequently inefficiency in expenditure at the level of the service provider
Understanding differences in regional performance For our study, we chose Bihar since it shows weakness in both the performance parameters. Nearly 30% of funds released was not utilized, the plan size was 50% more than the actual expenditure
Resource Mapping Tool I. Basic School Information II. Teacher Information
III. Grant Information Code: 1. money reached late; 2. no information on money transfer; 3. difficulty in withdrawing money from bank account; 4. no knowledge of type of grant for which money is transferred; 5. others (specify______________________________________) IV. One Lakh Question “If school is given one lakh rupees, what would you spend that money on?”
Schools Reporting Grants Receiving : Schools that have received SSA grants until 26th March, 2009 Spending : Out of those who have received grants, schools that have spent Insufficient: In respondent (mostly headmaster) opinion, whether grant amount sufficient for the purpose or not
Top line: Timeline of grants received Bottom line: Timeline of grants spent Grants transferred through cheque from District to Block to School Earliest transfer recorded in October
First SMG expenditure reported in December 80% report expenditure between January and March
Similar receipt pattern, but slightly better expenditure timeline TLM is spent at the discretion of the teachers and Headmaster Difference with SDG and SMG maybe due to easier spending norms
Systemic Inefficiencies: Reason why grants are unutilized VSS: Vidyalay Shiksha Samiti – Community groups set up under SSA to monitor civil works, grants and teacher presence, identify out-of-school children, and organize mid-day meals Administrative problems included teacher absence due to training, deputation for examination duties and updating voter list
Responses to “One-Lakh Question” Headmasters/Senior Teachers were asked about the problems faced by the school. They were then given a hypothetical situation where the school gets a grant of one-lakh rupees. Investigators were asked to probe the question and get a combination of two or more categories. Each expenditure had to be backed by unit cost calculation. For example, if schools asked for furniture, cost of each desk, chair or bench had to be stated. This question was asked to ascertain the real need of the school vis-à-vis the SSA grants
Summary of amount asked for by Schools in different categories
Lessons Learnt • What works? • Good sampling strategy • Repeated pilots of survey tool • Background research on the sector to identify the PETS issue • Highlighting interesting case studies • Simple graphs, not too many cross-tabulations • Clear advocacy agenda • What doesn’t work? • Complicated survey tool • Investigators without local knowledge/contacts • Lag between collection, analysis and dissemination • Only critique, no suggestion to make things better