Download
1 / 23
230 likes | 359 Vues
Imaging of Neutron Fields with Submicron Resolution. R. Gregory Downing. Inorganic Chemical Metrology Group Analytical Chemistry Division Chemical Science and Technology Laboratory National Institute of Standards and Technology. The Challenge:

E N D
Imaging of Neutron Fields with Submicron Resolution R. Gregory Downing Inorganic Chemical Metrology Group Analytical Chemistry Division Chemical Science and Technology Laboratory National Institute of Standards and Technology
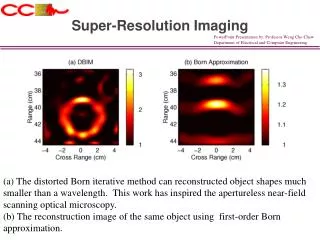
The Challenge: develop a new concept for neutron radiography detectors An imaging technique that would … break the 10 micrometer spatial resolution barrier
Existing Technologies: basically limited by the size of the electron charge cloud produced following a neutron-atom reaction… Gaseous amplifiers electron clouds Phosphors light cones Pixels Capacitance well size
What really is required is… a paradigm shift in how we capture the information on where the neutron reaction occur!
E = 2054 keV 4He n 6Li 3He 5333b 3He(n,p)3H E = 2727 keV 3H 6Li 940b 6Li(n,3H)4He Particle emission is diametrical 10B 3837b 10B(n,4He)7Li xxxGd xxxGd(n,ge)xxyGd >>10000b
Time-of-Flight (ToF) Coincidence Encoder Neutron Beam Neutron Converter Encoder
t2 t1 The reaction gives a unique coordinate solution • Known: • Mass of each particle • Initial energy of each particle • Stopping power of converter • Stopping rate for each particle is different • Measure: • The unique time of flight (ToF) for each particle pair • Two PSD encoders establish the x-y coordinates for each pair • Impose conditions: • Min./Max. delta time window for the coincidence pair • Line segment must pass through detector volume • Particle pair must yield a unique depth • A Jacobian Transformation defines unique angular emission & confirms measured angle • Calculate: • TOF Residual energy for each particle pair unique depth (x) of each reaction • Position sensitive encoder establishes a unique (y,z) position for the reaction • Variation in time/energy/stopping power/x-y position give spatial uncertainty • List mode output
Particle Energy (keV) 3 H 2727.877 4 He 2055.515 Max. Range (micrometers) Substrate 3 4 H He LiF 33.45 6.07 Aluminum 37.94 6.73 Silicon 42.95 7.51 Lithium 132.85 23.29 Gold 1002 Å 1060Å for 45/22.5 keV Charged particle ranges in the converter material for the 6Li(n,3H)4He reaction defines the optimal thickness
n 6Li(n,3H)4He Assume a 5 mm thickness of LiF, Encoders are 5 cm away from LiF Then the particle TOF differences are either 118 ns (T/a) or 10 ns (a/T) 3H 4He Thus for 50 nm position resolution in the converter thickness dimension: The timing resolution required is varies from 5.6 ns to 0.22 ns 4He 3H Resolution along length of a plate converter is < 40 mm Li - rich converter High-speed encoder electronics
Example of an encoder - > 45 mm x 45 mm active area Therefore the converter must be thin (few mm), but can be several cm in length, giving good solid angle coverage to collect charged particles emerging from the converter.
Off-set stacking to gain increased imaging area … Side view Top view … but a progressive loss of resolution due to L/D beam broadening
Potential Error Sources: Beam Divergence Surface Roughness
Resulting Real-Time High-Resolution Radiograph Intense Neutron Beam Sample for Study Detector System
An alternative converter geometry leading to more precise X-Y definition? into screen is the direction of neutron travel Encoder Cylindrical Converter Encoder
Alternative Converter Concepts with Increased Area Top View Top View Side View Side View
Weaknesses: • Accuracy of stopping power tabulations • Getting sufficient neutrons on the detector to take full advantage of resolution! • Challenges: • Alignment of detector with beam direction • Alignment of sample with detector • Good quality material and precise production of the converter shape
Strengths: • Resolution in one dimension: 0.1 to << 0.01 mm • Resolution in 2nd dimension: > 1) 40 mm or 2) << 0.01 mm • Speed – Real-time image building • Reasonable coverage area 3 orders of magnitude • Continuous coverage – virtually nonpixilated detector • Position uncertainty determined with each data point • Encoders are out of the neutron/gamma beam. • Scanning of sample by moving it over the converter and time tagging each event with the known sample location.
Potential applications • Sum along the length of the converter to increase statistics while at high resolution for 1D studies. Also gives realistic possibility for real-time analysis • Single or few cell studies in biological specimens • Grain boundaries in geological, metallurgical or biological specimens
Charged-Particle Channeling Possible measured energy variations due to converter crystal structure Channel blocking Random Channeling