Download
1 / 23
240 likes | 648 Vues
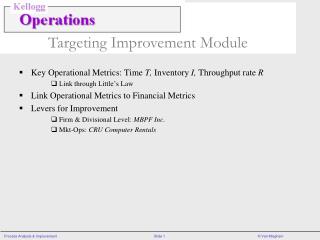
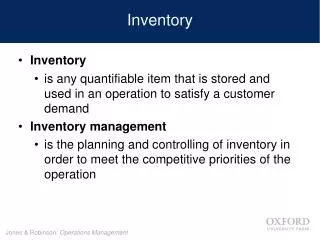
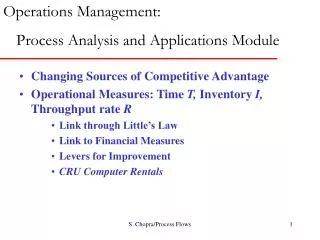
Operations Management: Process Analysis and Applications Module. Changing Sources of Competitive Advantage Operational Measures: Time T, Inventory I, Throughput rate R Link through Little’s Law Link to Financial Measures Levers for Improvement CRU Computer Rentals.

E N D
Operations Management: Process Analysis and Applications Module • Changing Sources of Competitive Advantage • Operational Measures: Time T, Inventory I, Throughput rate R • Link through Little’s Law • Link to Financial Measures • Levers for Improvement • CRU Computer Rentals S. Chopra/Process Flows
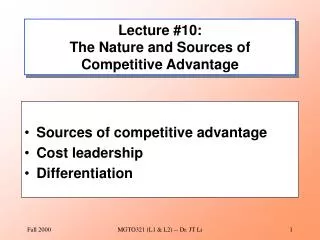
Low Cost & Scale Economies (< 1960s) You can have any color you want as long as it is black Focused Factories (mid 1960s) Flexible Factories and Product variety (1970s) A car for every taste and purse. Quality (1980s) Quality is free. Time (late 1980s-1990s) We love your product but where is it? Don’t sell what you produce. Produce what sells. How can operations help a company compete?The changing sources of competitive advantage S. Chopra/Process Flows
Operational Performance Measures • Flow time • Throughput • Inventory • Process Cost • Quality S. Chopra/Process Flows
The business imperative: creating economic value x + + + + + - - x Improvement levers • Increase price • Increase throughput Price Revenues Quantity Profit Material Labor Costs • Reduce costs • Improve quality Energy Economic value added (EVA) Overhead PP&E • Reduce capital intensity • Reduce inventory Capital invested Inventory Opportunity cost Other Reduce time Weighted average cost of capital Operational metrics Financial metrics S. Chopra/Process Flows
Relating operational measures (flow time T, throughput R & inventory I) with Little’s Law Flow rate/Throughput R [units/hr] Inventory I [units] • Inventory = Throughput x Flow Time I = R xT • Turnover = Throughput / Inventory = 1/ T ... ... ... ... ... Flow Time T[hrs] S. Chopra/Process Flows
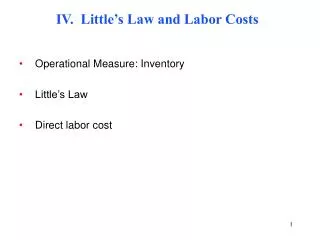
Process Flow Examples Customer Flow: Taco Bell processes on average 1,500 customers per day (15 hours). On average there are 75 customers in the restaurant (waiting to place the order, waiting for the order to arrive, eating etc.). How long does an average customer spend at Taco Bell and what is the average customer turnover? Job Flow: The Travelers Insurance Company processes 10,000 claims per year. The average processing time is 3 weeks. Assuming 50 weeks in a year, what is the average number of claims “in process”. Material Flow: Wendy’s processes an average of 5,000 lb. of hamburgers per week. The typical inventory of raw meat is 2,500 lb. What is the average hamburger’s cycle time and Wendy’s turnover? S. Chopra/Process Flows
Process Flow Examples Cash Flow: Motorola sells $300 million worth of cellular equipment per year. The average accounts receivable in the cellular group is $45 million. What is the average billing to collection process cycle time? Question: A general manager at Baxter states that her inventory turns three times a year. She also states that everything that Baxter buys gets processed and leaves the docks within six weeks. Are these statements consistent? S. Chopra/Process Flows
MBPF Inc.: Consolidated Statement S. Chopra/Process Flows
MBPF Inc.: Balance Sheet S. Chopra/Process Flows
MBPF Inc.: Inventory and Cost of Goods S. Chopra/Process Flows
$60.2/yr $25.3/yr $110.3/yr $50.1/yr $6.5 $15.1 Raw Materials (roofs) Fabrication (roofs) $175.8/yr $175.8/yr $10.6 $9.8 $40.2/yr Assembly Finished Goods $8.6 $40.2/yr Purchased Parts (bases) MBPF Business Process Flows S. Chopra/Process Flows
MBPF Inc.: Flow Times S. Chopra/Process Flows
Flow rate R ($/week) 5.0 3.38 Accounts Receivable 2.12 Assembly Finished Goods Fabrication 0.96 Raw Materials 0.77 Purchased Parts 11.12 6.75 7.12 3.14 2.90 5.80 Flow Time T (weeks) S. Chopra/Process Flows
Why the Difference in Performance? S. Chopra/Process Flows
CRU Computer Rentals S. Chopra/Process Flows
Case: CRU Computer Rentals Flow Chart Status 40 Ship Receiving Repairs 30% 70% Status 24 15% Parts places order Receives from Supplier Customer Pre-Config Status 41 Status 32 Ship Config Repairs Status 20 Status 42 S. Chopra/Process Flows
CRU Situation in Previous Year:Customer term = 8 wks, Demand = 1000 units/wk S. Chopra/Process Flows
CRU Situation in Previous Year: Financial Performance • Number of units on rent = 8,000 • Total number of units = 14,405 • Utilization = 0.56 (56%) • Revenue rate = 8,000 x 30 = $240,000/wk • Variable Cost rate = 25 x 1,000 (R) + 25 x 1,000 (S) + 4x700x.85 + 150 x 405 = $113,130/wk • Contribution Margin = $126,870/wk • Depreciation = 14,405 x ($1000/156wks) = $92,340/wk • bottomline = $126,870-$92,340 = $34,530 S. Chopra/Process Flows
CRU Situation in Current Year: flow times unchanged,Demand = 1400 units/wk S. Chopra/Process Flows
CRU Situation in Current Year: flow times unchanged,Demand = 1400 units/wk • Number of units on rent = 8,000 • Total number of units = 16,967 • Utilization = 0.47 (47%) • Revenue = 4,800 x 30 + 3,200 x 35 = $256,000/wk • Cost = 25 x 1,400 (R) + 25 x 1,400 (S) + 4 x 980x .85 + 150 x 567 = $158,382/wk • Contribution Margin = $97,618/wk • Depreciation = 16,967 x (1000/156) = $108,763/wk • bottomline = $97,618 - $108,763 = -$11,145 S. Chopra/Process Flows
CRU Potential situation in Current Year:without sales drive,Demand = 600 units/wk S. Chopra/Process Flows
CRU Potential situation in Current Year:without sales drive,Demand = 600 units/wk • Number of units on rent = 4,800 • Total number of units = 8,643 • Utilization = 0.56 (56%) • Revenue = 4,800 x 30 = $144,000/wk • Cost = 25 x 600 (R) + 25 x 600 (S) + 4x420x .85 + 150 x 243 = $67,878/wk • Contribution Margin = $76,122/wk • Depreciation = 8,643 x (1000/156) = $55,404/wk • bottomline = $76,122 - $55,404 = $20,718 S. Chopra/Process Flows
Learning ObjectivesBasic Process Analysis • Process Measures: time, inventory, and throughput • What is an improvement? • Link financial measures to operational ones • Good operational measures are leading indicators of financial performance • Using Little’s law for process flow analysis • Targeting areas and performance measures for improvement; link financial and operational flows S. Chopra/Process Flows