Process Flow Thinking
Process Flow Thinking. Overview. Process flow is about how the product or service is made. Some measures we will want to study include: Throughput time, flow rate, inventory, capacity and bottlenecks. Process thinking, in the mind of the author is a powerful, but neglected tool in business.


Process Flow Thinking
E N D
Presentation Transcript
Overview Process flow is about how the product or service is made. Some measures we will want to study include: Throughput time, flow rate, inventory, capacity and bottlenecks. Process thinking, in the mind of the author is a powerful, but neglected tool in business.
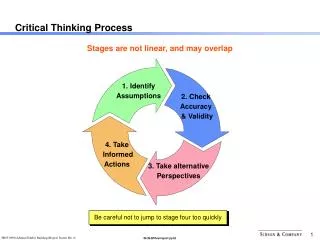
Process Thinking A system is a collection of interrelated parts where the whole is greater than the sum of the parts. We want to think about the business organization and production process as a system. The parts of a business are the functions of marketing, operations, finance, accounting, HR, and information systems. Each is needed to make the business work. Many small businesses have one person do all these things. In the large corporations you have separate groups work on these items. Again, the whole firm is greater than the sum of each of these parts. Another way to break the firm is by thinking about processes, not function. Examples of processes are strategic planning, order entry and supplying the product.
Little’ Law Little’s Law is a process flow measure written I = T times R, Where I = average number of things in the system (inventory), T = average throughput time, and R = average flow rate into the process. Throughput time is the time from when the product first starts being processed until it is finished (and maybe shipped). Example: airport security Say R = 5 passengers per minute can be screened, and T = 20 minutes on average per passenger to get through the security check line, then I = 20 (5) = 100, or 100 is the average number of passengers waiting in the system – you might call this inventory.
Another Example Say a factory can make 100 units per day, or R = 11, and say the average throughput is 10 days (T = 10), then I = 10 (100) = 1000, or 1000 units of inventory will be on hand on average.
Another Example – a modification of Little’s Law We saw I = T (R), but we could also say T = I/R. As an example here the amount of money in accounts receivable can be viewed as an inventory. If I = 2 million, and if $20,000 per day enters accounts receivable (R), then T = 2million/20,000 = 100 days would be the throughput time. This means it takes 100 days to get all the accounts receivable.
Capacity Capacity is the maximum rate of output of a process or the maximum flow rate that can be sustained over a period of time. If a process is composed of several resources (say n resources) that must each have processing time, then the process capacity is the minimum value of the capacity of each of the n resources. As an example say n = 2 with resource 1 having a capacity of 5 and resource 2 have a capacity of 6. Then the process capacity is 5. The resource with the smallest capacity is the constraining resource, or the bottleneck resource. IN the example here the bottleneck would occur with resource 1.
Flow Rate The flow rate, or the amount a process actually produces , is also the minimum of the demand for the product, the supply of the product or the capacity of the process. Example: Say the demand for a product is 75 units per day, the capacity is 200 units per day and the supply is 100 units per day. The process flow rate would then be 75 units per day. In the example if we take the 75 units per day of actual product and divide by the capacity of 200, we get the factory utilization rate of 75/200 = .375, or 37.5% factory utilization.
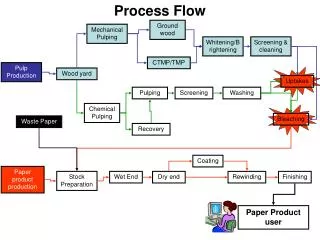
Pizza Example On page 115 there is an example about a Pizza company. There are three resources. The flow of an order is from the top of the table to the bottom. To find the capacity of the system note we have three resources: The assistant needs 3 minutes per pizza, so can do 60/3 = 20 pizzas per hour, the chef needs 5 minutes per pizza, so can do 60/5 = 12 pizzas per hour, and the oven can do 4 pizzas in 24 minutes, or (60/24)4 = 10 pizzas per hour (you can add half done pizzas). Capacity = minimum(20, 12, 10) = 10 The bottleneck is the oven.
Example continued The throughput time is found by adding up all the times since none can be done concurrently (Don’t want to make the crust early so that it is fresh). The result is 32 minutes. The flow rate could be the capacity of 10 pizzas per hour, but it could be less if demand is less than that. Assume the following: chef gets $10 per hour, assistant gets $8 per hour, and overhead cost is 50% of direct labor cost. Say ingredients cost $2 per pizza. If demand is 60% of capacity 6 pizzas get made per hour. The total labor cost would be $18 for the hour. Add in $9 for the overhead cost. Ingredients add $12 to cost per hour. The cost per hour would be 18 + 9 + 12 = 39, or 39/6 = 6.50 per pizza.
Flowcharts At this time I am going to hold off on flowchart analysis.