Download
1 / 22
220 likes | 351 Vues
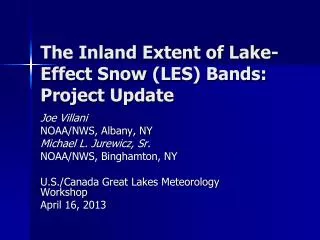
The Inland Extent of Lake-Effect Snow (LES) Bands: Project Update . Joe Villani NOAA/NWS, Albany, NY Michael L. Jurewicz, Sr. NOAA/NWS, Binghamton, NY U.S./Canada Great Lakes Meteorology Workshop April 16, 2013. Outline. Goals Methodology Results Forecast application

E N D
The Inland Extent of Lake-Effect Snow (LES) Bands: Project Update Joe Villani NOAA/NWS, Albany, NY Michael L. Jurewicz, Sr. NOAA/NWS, Binghamton, NY U.S./Canada Great Lakes Meteorology Workshop April 16, 2013
Outline • Goals • Methodology • Results • Forecast application • Latest improvement efforts • Future Work
Goals • Single out the atmospheric ingredients typically most influential on the inland extent (IE) of LES bands • Use this information to formulate predictive techniques in an operational setting
Methodology • Investigate LES events over an extended period (2006-2009 across Central/Eastern NY) • Pick a number of locations both inside and just outside of LES bands at specified time intervals (0000, 0600, 1200, and 1800 UTC) • Select parameters and see which correlate best to IE distances • 12 km NAM initial-hour soundings
Example of Data Points Points in and near the LES band ALY sounding BUF sounding
Correlations • Best IE parameters: (ALY) [BGM] • Multi-Lake connection (MLC, Yes or No) = [0.73] (0.59) • 850 mb lake-air differentials = (-0.64) [-0.63] • Capping Inversion Hgts = (0.53) • 0-1 km speed shear = (0.44) [0.34] • 0-3 km speed shear = [0.03] • Bottom line: Lake-lake influence + Elevated ML + Cond/Mdt Instab + Strong 0-1 km flow = Deep IE (Type A)
Favorable IE (Type A) Example Sounding Corresponding Radar
Unfavorable IE (Type B) Example Sounding Corresponding Radar
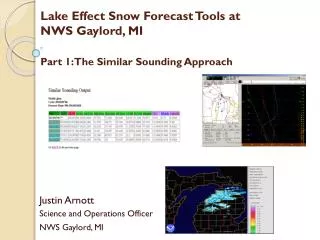
Another Recent Type B Radar Image (22 Jan 13) IE Application Output
IE Application Example • * Prior statistics / correlations boil down to a multi-element regression equation • * Produces an IE estimate for Lk Ont bands
IE Application Results • For LES events that impacted Central NY (WFO BGM), results were fairly similar to those from Eastern NY (WFO ALY) • W flow events (250-280 wind vector) • Mostly single-band cases • Usually good IE estimates (within 10-20 miles) • Tendency to under-estimate for deep inland bands • NW flow events (290-330 wind vector) • Mix of single and multi-bands • Under-estimated at times
Under-Estimate Source ? • Which term(s) of the IE equation were most problematic? • It would seem those dealing with moisture availability • A simple Y/N for MLC likely not adequate • How do we improve?
“Effective Fetch” • This concept was designed to better represent moisture contributions from upstream lakes • Tries to simulate the additive effects of long fetch distances
IE Term Adaptation Choice of upstream lakes now available
Example from 6-7 Dec 2010 in WFO BGM’s Area IE Output: 80 nm
Visible Satellite Image * Effective fetch across Georgian Bay/Lake Ontario was nearly 200 nmi * Modifying the MLC term improved the IE output substantially
Anticipating MLC • Not necessarily intuitive in forecast mode • What tools can be provided to help operational meteorologists in this regard? • Trajectories • Analogs / Composites • Simulated Satellite / Radar products
Using Synoptic Analogs/Composite Plots * Can help forecasters identify favorable patterns when extensive IE might be expected * Could conceivably stratify by flow regime / type of event
The Future • Better visualization • Efforts are underway to add a graphical component to the current AWIPS IE application • IE application could conceivably be adapted to other portions of the Great Lakes region • Do high-resolution models reasonably simulate inland extent ?
Questions? Joe.Villani@noaa.gov Michael.Jurewicz@noaa.gov