Download
1 / 84
950 likes | 1.61k Vues
Near Infrared (NIR) Spectroscopy Instrumentation Paul Geladi. Paul Geladi. Head of Research NIR CE Chairperson NIR Nord Unit of Biomass Technology and Chemistry Swedish University of Agricultural Sciences Umeå Technobothnia Vasa paul.geladi @ btk.slu.se paul.geladi @ uwasa.fi. Content.

E N D
Paul Geladi Head of Research NIRCE Chairperson NIR Nord Unit of Biomass Technology and Chemistry Swedish University of Agricultural Sciences Umeå Technobothnia Vasa paul.geladi @ btk.slu.se paul.geladi @ uwasa.fi
Content • Spectroscopy? • Instrumentation • Modes of measurement
Content • Spectroscopy? • Instrumentation • Modes of measurement
Content • Spectroscopy? • Energy levels in atoms, molecules, crystals • Example IR-NIR calculations • Related techniques
Content • Spectroscopy? • Energy levels in atoms,molecules, crystals • Example IR-NIR calculations • Related techniques
Spectroscopy • Interaction of radiation and matter • Electromagnetic radiation • Gases, liquids, solids, mixtures • Heterogeneous materials
Electromagnetic radiation Cosmic Gamma Xray UV VIS NIR IR Micro Radio
Electromagnetic radiation • Cosmic > 2500 KeV • Gamma 10-2500 KeV • Xray 0.1-100 KeV • Ultraviolet 10-400 nm • Visible 400-780 nm • Near Infrared 780-2500 nm • Infrared 2500-15000 nm • Microwave GHz • Radio MHz-KHz
Why interaction? • Photon energy matches some energy level • E = hn • E = hc/l • Planck’s constant 6.63 10-34
Some useful constants • qe= 1.602176462*10-19 As • me = 9.10938188*10-31 Kg • c = 2.99792458*108 m/s • h = 6.62606876*10-34 Js • 1 Joule to Electronvolt 6.241506363094028*1018
Units • Joule (energy) • Electron volt (KeV) • Wavelength (nm, mm, mm) • Inverse cm (cm-1) • Frequency (GHz,MHz,KHz)
Content • Spectroscopy? • Energy levels in atoms,molecules, crystals • Example IR-NIR calculations • Related techniques
HCl molecule (no true sizes) = electron Xray UV,VIS H Cl NIR,IR UV,VIS Gamma ray
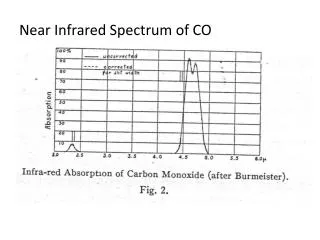
Photon-matter interaction • Atomic nucleus = gamma ray • Inner electron = Xray • Outer electron, chemical single bond = UV • Chemical double, triple bond = UV,VIS • Molecular vibration overtone = NIR • Molecular vibration = IR • Molecular rotation = Micro
E Quantized energy levels First excited level hn Ground level
What can be measured? Emission Absorption Fluorescence
E Emission First excited level Thermal hn Ground level
E Absorption First excited level Thermal hn Ground level
E Fluorescence First excited level hn hn out Ground level
Techniques? • Gamma spectrometry • Instrumental neutron activation analysis • Xray spectrometry • UV-VIS spectrometry (AES,AAS,ICP...) • NIR spectrometry • IR spectrometry • Raman spectrometry • Microwave spectrometry
What can be used? Intensity Position Intensity, integral Width Energy
Special topics • Polarization • Time resolved spectroscopy
Content • Spectroscopy? • Energy levels in atoms,molecules, crystals • Example IR-NIR calculations • Related techniques
Morse curves The Morse curve describes the potential energy V of a diatomic molecule as a function of interatomic distance x. V = De [1-exp(-bx)]2
If the atoms go far apart the bond breaks. It is impossible to press the atoms close together. Enormous amounts of energy are needed.
De = 10 b = 0.4 Zero = equilibrium distance
F Fundamental O1 First overtone O2 Second overtone Quantum levels = discrete O2 O1 F
This was diatomic molecules Polyatomic molecules: M=3N-6 quantized vibration modes M=3N-5 linear molecules (N=1) N=3 , M=3 H2O, H2S, SO2 N=4 , M=6 etc
Triatomic molecules • G(a,b,c)=v1(a+1/2) + v2(b+1/2) + v3(c+1/2) • Energy levels • a=b=c=0 (0,0,0) • a=1 b=c=0 (1,0,0) • a=2 b=c=0 (2,0,0) • a=0 b=1 c=0 etc (0,1,0)
Hot band Overtone Combination band (0,0,2) Fundamental (0,2,0) (0,0,1) (2,0,0) (0,1,0) (1,0,0) (0,0,0) Ground level a c b
Intensity • Some transitions are more probable • Gives more intense bands • Fundamentals in Gas phase • Overtones in liquid,solid • Combination bands in liquid, solid
Hot bands • Only exist because of thermal excitation • Boltzmann • Ne = No exp(-DE/kT) • Ne number excited, No number ground • k Boltzmann constant 1.3806503*10-23 J/K • DE energy difference
Why cm-1? Additive
S02 wavenumber band 519 v2 606 v1-v2 1151 v1 1361 v3 1871 v2+v3 2296 2v1 2499 v1+v3
Thermal radiation • Planck’s law • W(l) = c1l-5[exp(c2l-1 T-1)-1] • T °K • c1 = 1.91*10-12 • c2 = 1.438*104 • lmm
Radiance 4000 K (Tungsten melts) 3500 K 3000 K 2500 K 2000 K mm
Planck curves More total energy for high temperature More UV for high temperature More flat curve for low temperature
Content • Spectroscopy? • Energy levels in atoms,molecules, crystals • Example IR-NIR calculations • Related techniques
Energy supply • Photon • Thermal • Electron - • Proton + • Ion + -
Optics • Electron optics • Ion optics
Techniques • Electron microscopy • Electron spectroscopy • Mass spectrometry • Ion microscopy
Transmission Mono- chromator Detector Readout electronics Radiation source Sample cell
Transmission Mono- chromator I0 It Detector Readout electronics Radiation source Sample cell
Lambert-Beer-Bouguer lawTransmissionAbsorbance T = It / I0 A = log10 ( I0 / It) = -log10 (It / I0)
Lambert-Beer-Bouguer law A = klC l = path length k = constant C = concentration
Reflection Mono- chromator Detector(s) Readout electronics Radiation source Sample cell