Download
1 / 41
410 likes | 599 Vues
Cardio Diabetes Master Class Asian chapter January 28-30 2011, Shanghai. Presentation topic. (Pre) diabetes & sustained glycemic control: How and what is the time to act?. Slide lecture prepared and held by:. Dr Stanley S Schwartz, MD University of Pennsylvania Philadelphia, USA.

E N D
Cardio Diabetes MasterClass Asianchapter January 28-30 2011, Shanghai Presentation topic (Pre) diabetes & sustained glycemic control: How and what is the time to act? Slide lecture prepared and held by: Dr Stanley S Schwartz, MD University of Pennsylvania Philadelphia, USA
Natural History of Type 2 Diabetes Age 0-15 15-40+ 15-50+ 25-70+ Envir.+ Other Disease Genes Macrovascular Complications Obesity (visceral) Poor Diet Inactivity IR phenotypeAtherosclerosisobesityhypertensionHDL,TG, HYPERINSULINEMIA Endothelial dysfunctionPCO,ED Disability Insulin Resistance MICVAAmp FBS>5.5,ppg>7.8 DEATH IGT/IFG Type II DM Beta Cell Secretion BlindnessAmputationCRF EyeNerveKidney Risk of Dev. Complications ETOHBPSmoking Disability Microvascular Complications
Genes Genes Insulin resistance- lipotoxicity b-cell dysfunction/ Failure; dec. mass ± Environment ± Environment IFG IGT Glucose Toxicity Glucose Toxicity Type 2 diabetes Type 2 Diabetes: Two Principal Defects; Overview Abn. First phase peripheral hepatic 1st & 2nd DM will NOT occur if B-cells not genetically predisposed Reaven GM. Physiol Rev. 1995;75:473-486 Reaven GM. Diabetes/Metabol Rev. 1993;9(Suppl 1):5S-12S; Polonsky KS. Exp Clin Endocrinol Diabetes. 1999;107 Suppl 4:S124-S127.
Genes that Cause or are Associated with Diabetes • Insulin Secretion • Neonatal KCNJ11/Kir6.2 • ABCC8/Sur1 • Insulin • MODY HNF-1α,1β, 4 α • Glucokinase • PDX1/IPF1 • Neurod1/Beta2 • KLF11 • CEL • Mitochondrial diabetes • Type 2 • CDKAL1 • TCF7L2 • HHEX/IDE • SLC30A8/ZNT8 • WFS1 • NOTCH2-ADAM30 Insulin action Insulin receptor PPARG PHENOTYPE- eg: age of presentation, IFG/ IGT/Both/ severity depends on number of which kind of genes a person inherits – GENOTYPE Obesity FTO MCR4 Unknown IGFBP2 CDKN2A/B KIF11 JAZF1 CDC123-CAMK1D TSPAN8-LGR5 THADA ADAMTS9 NOTCH-ADAM30 Modified from McCarthy, NEJM 363:24,2339.
Size and Time of Meal Determine Postprandial Duration Time of Meal 5 4.7 8:00 AM 4.1 4.1 1:00 PM 4 6:00 PM Time (h) for glucose to return to premeal value 3 2.4 2.4 2.1 1.9 2 1.7 1.3 1 0 Medium meal (25%) Large meal (50%) Small meal (12.5%) Meal Size (% total daily calories) Service J. Diabetologia. 1983;25:316.
Mechanism of Glucotoxicity and Lipotoxicity The Glucosamine Hypothesis Glucose FFA Glucose FFA Other pathways Increased glucosamine Other pathways Impaired insulin secretion from -cell Insulin resistance in muscle and fat FFA=free fatty acid Hawkins M et al. J Clin Invest. 1997;99:2173-2182; Rossetti L. Endocrinology.2000;141:1922-1925
Insulin Secretion Increases With Decreasing Insulin Action and Vice Versa 500 400 300 200 100 0 Non-Progressors NGT Insulin SecretionAIR (µU/mL) NGT NGT NGT IGT Progressors DIA 0 1 2 3 4 5 Insulin ResistanceM-low (mg/kg EMBS per minute) Changes in AIR relative to changes in M-low in 11 Pima Indian subjects in whom glucose tolerancedeteriorated from normal (NGT) to impaired (IGT) to diabetic (DIA) (progressors), and in 23 subjectswho retained NGT (nonprogressors). The lines represent the prediction line and the lower and upperlimits of the 95% confidence interval of the regression between AIR and M-low asderived from a reference population of 277 Pima Indians with NGT.
IGT SAM: Insulin Secretion/Insulin Resistance Index During OGTT- Progressive loss of Beta-cell Function Whether Lean or Obese Adapted from Gastaldelli A, et al. Diabetologia. 2004;47:31-39.
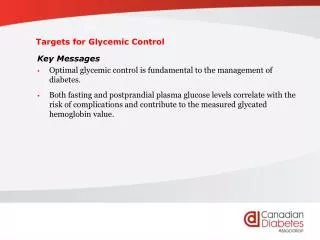
Clinical Consequences of Abnormal First- phase Secretion and Elevated Post-Prandial Sugars • PPG increases • Variability • Microvasular disease and adverse pregnancy outcomes • ASVD risk factors • adverse CV outcomes • Treating elevated PPG leads to • Reduce Microvasular disease and Pregnancy Outcomes • Reduce CV Markers and Outcomes • Prevent Diabetes
Clinical Consequences of Abnormal First- phase Secretion and Elevated Post-Prandial Sugars • PPG increases • Variability • Microvasular disease and adverse pregnancy outcomes • ASVD risk factors • adverse CV outcomes • Treating elevated PPG leads to • Reduce Pregnancy Outcomes • Reduce CV Markers and Outcomes • Prevent Diabetes
Prevalence of Retinopathy vs Durationof Type 2 Diabetes Patients with retinopathy(%) Time of diagnosis 80 Wisconsin population 60 Apparent onset prior to diagnosis DM= Prediabetes 40 Australian population 20 0 -10 -6.5 -4.2 0 5 10 15 20 Years Harris MI et al. Diabetes Care. 1992;15:815-819
Abnormal PPG associated with Macrosomia Infant Birth Weight Percentile 180 160 >97 140 90–96 120 75–89 100 50–74 Mean Nonfasting Glucose 25–49 80 10–24 60 3–9 40 <3 20 0 1st Trimester 2nd Trimester 3rd trimesterr Macrosomia associated with increased C-section rate, infant morbidity Jovanovic-Peterson et al. Am JObstetGynecol 1991;164:103..
Clinical Consequences of Abnormal First- phase Secretion and Elevated Post-Prandial Sugars • PPG increases • Variability • Microvasular disease and adverse pregnancy outcomes • ASVD risk factors • adverse CV outcomes • Treating elevated PPG leads to • Reduce Pregnancy Outcomes • Reduce CV Markers and Outcomes • Prevent Diabetes
Clinical Consequences of Abnormal First- phase Secretion and Elevated Post-Prandial Sugars • PPG increases • Variability • Microvasular disease and adverse pregnancy outcomes • ASVD risk factors • adverse CV outcomes • Treating elevated PPG leads to • Reduce Pregnancy Outcomes • Reduce CV Markers and Outcomes • Prevent Diabetes
Clinical Consequences of Abnormal First- phase Secretion and Elevated Post-Prandial Sugars • PPG increases • Variability • Microvasular disease and adverse pregnancy outcomes • ASVD risk factors • adverse CV outcomes • Treating elevated PPG leads to • Reduced Microvasular disease and Pregnancy Outcomes • Reduce CV Markers and Outcomes • Prevent Diabetes
Reduction of Retinopathy in Patients with IGT in Da Qing Study Gong et al Diabetologia 54 :300,2011
Effectiveness of Postprandial Monitoring and Treatment Reduces Adverse Outcomes 45 40 35 30 No Care 25 Preprandial 20 Postprandial † 15 * *P=.05 †P=.04 ‡P=.01 ‡ 10 5 0 Large for Gestational Age Cesarean Section Neonatal hypoglycemia DeVeciana et al. NEnglJ Med 1995;26:774.
Clinical Consequences of Abnormal First- phase Secretion and Elevated Post-Prandial Sugars • PPG increases • Variability • Microvasular disease and adverse pregnancy outcomes • ASVD risk factors • adverse CV outcomes • Treating elevated PPG leads to • Reduce Pregnancy Outcomes • Reduce CV Markers and Outcomes • Prevent Diabetes
Early Treatment, Even in Overt Diabetes, Decreases Micro and Macro Vascular RISK &DCCT
Clinical Consequences of Abnormal First- phase Secretion and Elevated Post-Prandial Sugars • PPG increases • Variability • Microvasular disease and adverse pregnancy outcomes • ASVD risk factors • adverse CV outcomes • Treating elevated PPG leads to • Reduce Pregnancy Outcomes • Reduce CV Markers and Outcomes • Delay or Prevent Diabetes preserve beta-cell function and alter the natural history of type 2 Diabetes?
70 62% Finnish-Diet+ Exercise 58% 58% 60 55% Da Qing – Diet + Exercise 50 42% 41% DPP-Lifestyle 40 Diabetes Mellitus Reduction (%) 31% DPP-Metformin 30 25% STOP-NIDDM 20 TRIPOD XENDOS 10 DREAM 0 Diabetes Prevention Clinical Trials Is it Possible to Delay the Onset of Type 2 DM? 80% 80 55% PIOPOD ActNOW FINNISH=Tuomilehto J, et al. N Engl J Med 2001; 344: 1343-50 DA QING=Pan XR, et al. Diabetes Care. 1997; 20: 537-44 DPP=Diabetes Prevention Program. Nathan DM, et al. N Engl J Med 2002; 346:393-403 STOP-NIDDM=Study TO Prevent Non-Insulin-Dependent Diabetes Mellitus. Chiasson JL, et al. Lancet 2002; 359:2072–77 TRIPOD=Troglitazone in the Prevention of Diabetes. Buchanan T, et al. Diabetes 2002; 51(9): 2796-2803 XENDOS=XEnical in the Prevention of Diabetes in Obese Subjects. Torgerson JS, et al. Diabetes Care 2004; 27 (1): 155-61 DREAM=Diabetes Reduction Assessment with Ramipril & Rosiglitazone Medication. Gerstein H, et al. Lancet 2006; 368:1096-1105
ACT NOWStudy Results: Time to Occurrence of Diabetes (Kaplan-Meier analysis) 0.30 Placebo 6.8% per year HR = 0.19 (95%, CI) = 0.09, 0.39 P<0.00001 0.25 80% reduction in progression to DM 0.20 Cumulative Hazard 0.15 0.10 1.5% per year Pioglitazone 0.05 0 0 10 20 30 40 50 NNT = 3.5 patients with IGT for 1 year to prevent the development of 1 case of T2DM Months DeFronzo RA. ADA Scientific Sessions, Late-Breaking Clinical Studies, June 9, 2008.
β cell-specific effects of (PPAR-γ ) agonists in type 2 diabetes mellitus
Incretins • Increases Insulin Secretion and decreases glucagon secretion in a Glucose-dependent manner • Thus low risk hypoglycemia vs Sus • Improves First-phase insulin release, inc. b-cell mass in rodents • GLP-1 receptor agonists (not DPP-4 inhibitors) also decrease appetite, and slows gastric emptying which usually results in weight loss
And Reduce Variability Augers for Avoiding Step-Care Therapy; use Early CombinationTherapy
Relative Contribution of FBG and PPG Varies With A1C Range Inc PPG increases Micro- and macro- vascular disease Can’t get to glycemic goals, UNLESS control PPG (incretins, alpha-glucosidase inhibitors, TZDs, glinides, fast-insulin analogues) Adapted from Monnier L, et al. Diabetes Care. 2003;26:881-885.
Therapeutic Strategies for Improving B-cell function, treating Prediabetes, PPG, DM • Central dec. Dopa • sym.tone,inc HGP, • PPG • Fast-acting • bromocryptine
Revised Treatment Algorithm At diagnosis: Lifestyle + metformin STEP 1 Tier 1* Tier 2† HbA1C >7.0% STEP 2 Add basal insulin Add sulfonylurea Add GLP-1 agonist Add pioglitazone ± SU Intensive insulin STEP 3 The New ADA Guidelines for Type 2 Diabetes:AKA- David Nathan’s Regimen- DNR NOT Glyburide, chlorpropamide NOT Rosiglitazone Does Not Address Pathophysiology, Preservation B-cell function, PPG control
Monotherapy Metformin Pioglitazone GLP-1 agonist DPP-4 Inhibitor (or AGI) A Pathophysiologic Approach to Treating Diabetic Hyperglycemia-AACE Asymptomatic 6.5% 7.5% 9.0 HbA1c Continuum – if not at goal, advance Rx 12% Symptomatic Diet and Exercise • Dual Combination • Metformin • Pioglitazone • GLP-1 agonist • DPP-4 Inhibitor • (or AGI / secretagogue / colesevelam) • Triple Combination • Metformin • Pioglitazone • GLP-1 agonist • DPP-4 Inhibitor • (or AGI / secretagogue / colesevelam) • Insulin* • +/- Other agents • *Insulin analogs • Not NPH/regular • If over 9.0% or above and symptomatic • If triple combo fails Therapeutic Choice Should Match The Drug With Patient Characteristics Provided by Dr. Stanley S. Schwartz. AGI = alpha glucosidase inhibitor