Download
1 / 7
70 likes | 179 Vues
This survey report provides insights on respondents' demographics, participation in ADNA, key issues, and effectiveness ratings of ADNA. Majority are white males aged 25-36 with college degrees and yearly income of 50k-100k.

E N D
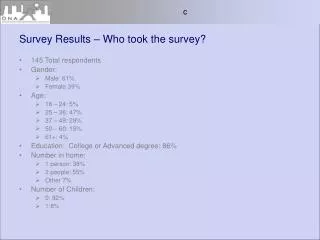
Survey Results – Who took the survey? • 145 Total respondents • Gender: • Male 61% • Female 39% • Age: • 18 – 24: 5% • 25 – 36: 47% • 37 – 49: 29% • 50 – 60: 15% • 61+: 4% • Education: College or Advanced degree: 86% • Number in home: • 1 person: 38% • 2 people: 55% • Other 7% • Number of Children: • 0: 92% • 1:8%
Survey Results – Who took the survey? • Ethnicity: • White: 88% • Black: 4% • Hispanic 1.4% • Other: 6.6% • Vehicles: • 0: 8% • 1: 44% • 2: 44% • 3+ :4% • Occupation: Professional (technical/non-technical): 46% • Annual Income: • < 50k: 32% • 50k – 100k: 50% • >100k: 18% • Type of residence: Condo/Loft (Owned, not rented, and participate in a resident association.)
Survey Results – Who took the survey? • Majority of respondents: • Male • White • Age 25-36 • College or Advanced degree • 1 – 2 people in household • 0 Children • 1 – 2 vehicles • Occupation: Professional (technical/non-technical): • Annual Income: 50k – 100k • Type of residence: Condo/Loft (Owned and participate in a resident association.)
Survey Results – ADNA Participation • 35% are ADNA members • 70% participate in ADNA functions • ADNA Events most respondents attended: • Downtown festival • Tour of Lofts • Downtown Dwellers Happy Hours • First Thursday’s Art Walk • 70% are interested in working on future ADNA initiatives.
Survey Results – Resident’s Issues • Issues where over 80% of respondents think attention is needed: • Encouraging economic development that reflects the desires of residents (91%) • Holding officials accountable for issues that affect residents (87%) • Representing resident’s views and opinions to local/state government (80%) • Issues where over 50% of respondents think attention is needed: • Representing resident’s views and opinions to commercial entities/companies (79%) • Attracting more residents to downtown (76%) • Enforcing zoning rules (73%) • Establish effective zoning rules (68%) • Issues where over 25% of respondents think attention is needed: • Diversifying the downtown population (41%)
Survey Results – ADNA effectiveness ratings • Very effective (9.1%) • Effective (34.8%) • Somewhat effective (23.5%) • Not effective (4.5%) • Don’t know (28%)
Survey Results – One piece of advice for ADNA • “Make yourself more visible.” • “Grow and become more organized.” • “Apply political pressure…” • “Poll its members more often.” • “Become very active with communications…” For detailed results including respondent’s comments, advice and Quality of Liferatings: http://www.surveymonkey.com/Report.asp?U=46433045183