Correlation of DHBA and DHPPA Urinary Concentrations Using Different Purification Protocols
Analyzing the Pearson’s correlation of DHBA and DHPPA urinary concentrations from various purification protocols to those from the most effective purification method. The data compares protocols A, B, and D with protocol C.

Correlation of DHBA and DHPPA Urinary Concentrations Using Different Purification Protocols
E N D
Presentation Transcript
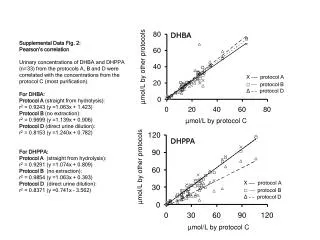
Supplemental Data Fig. 2: Pearson’s correlationUrinary concentrations of DHBA and DHPPA (n=33) from the protocols A, B and D were correlated with the concentrations from the protocol C (most purification). For DHBA:Protocol A (straight from hydrolysis): r2 = 0.9243 (y =1.063x + 1.423)Protocol B (no extraction):r2 = 0.9699 (y =1.139x + 0.906)Protocol D (direct urine dilution):r2 = 0.8153 (y =1.240x + 0.782) For DHPPA:Protocol A (straight from hydrolysis): r2 = 0.9291 (y =1.074x + 0.809)Protocol B (no extraction):r2 = 0.9854 (y =1.063x + 0.393)Protocol D (direct urine dilution):r2 = 0.8371 (y =0.741x – 3.562) DHBA X___protocol A □...... protocol B Δ__ protocol D DHPPA X___protocol A □...... protocol B Δ__ protocol D