EXAMPLES OF METRICS PROGRAMS
EXAMPLES OF METRICS PROGRAMS. MOTOROLLA Software metric program articulated by Daskalantonakis (1992). He followed Goal/Question/Metric paradigm of Basili and Weiss. Goals Goal 1: Improve project planning Goal 2: Increase defect containment Goal 3: Increase software reliability

EXAMPLES OF METRICS PROGRAMS
E N D
Presentation Transcript
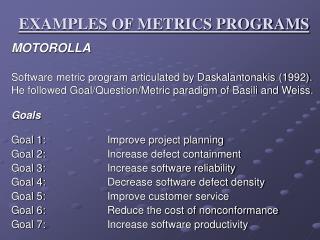
EXAMPLES OF METRICS PROGRAMS MOTOROLLA Software metric program articulated by Daskalantonakis (1992). He followed Goal/Question/Metric paradigm of Basili and Weiss. Goals Goal 1: Improve project planning Goal 2: Increase defect containment Goal 3: Increase software reliability Goal 4: Decrease software defect density Goal 5: Improve customer service Goal 6: Reduce the cost of nonconformance Goal 7: Increase software productivity
Measurement Areas Delivered defects and delivered defects per size Total effectiveness throughout the process Adherence to schedule Estimation accuracy Number of open customer problems Time that problems remain open Cost of nonconformance For each goal the question to be asked and the corresponding metrics were also formulated.
Goal 1: Improve project planning Question 1.1: What was the accuracy of estimating the actual value of project schedule? Metric 1.1: Schedule Estimation Accuracy (SEA) SEA = Actual project duration Estimated project duration Question 1.2: What was the accuracy of estimating the actual value of project effort? Metric 1.2: Effort Estimation Accuracy (EEA) EEA = Actual project effort Estimated project effort
Goal 2: Increase defect containment Question 2.1: What is the currently known effectiveness of the defect detection process prior to release? Metric 2.1: Total Defect Containment Effectiveness (TDCE) TDCE = Number of prerelease defects Number of prerelease defects + Number of post-release defects Question 2.2: What is the currently known containment effectiveness of faults introduced during each constructive phase of software development for a particular software product? Metric 2.2: Phase Containment Effectiveness for phase i (PCEi) PCEi = Number of phase i errors Number of phase i errors + Number of phase i defects
Goal 2: Increase defect containmentContd… Error: A problem found during the review of the phase where it was introduced. Defect: A problem found later than the review of the phase where it was introduced. Fault: Both errors and defects are considered faults.
Goal 3: Increase software reliability Question 3.1:What is the rate of software failures, and how does it change over time? Metric 3.1: Failure Rate (FR) FR = Number of failures Execution time
Goal 4: Decrease software defect density Question 4.1: What is the normalized number of in-process faults, and how does it compare with the number of in-process defects? Metric 4.1a: In-process Faults (IPF) IPF = In-process faults caused by incremental software development Assembly-equivalent delta sourcesize Metric 4.2b: In-process Defects (IPD) IPD = In-process defects caused by incremental software development Assembly-equivalent delta source size
Goal 4: Decrease software defect densityContd… Question 4.2: What is the currently known defect content of software delivered to customers, normalized by assembly-equivalent size? Metric 4.2a: Total Released Defects total (TRD total) TRD total =Number of released defects Assembly-equivalent total source size Metric 4.2b: Total Released Defects total (TRD delta) TRD total =No. of released defects caused by incremental s/w dev. Assembly-equivalent total source size
Goal 4: Decrease software defect densityContd… Question 4.3:What is the currently known customer-found defect content of software delivered to customers, normalized by assembly-equivalent source size? Metric 4.3a: Total Released Defects total (CFD total) CFD total = Number of customer-found defects Assembly-equivalent total source size Metric 4.2b: Total Released Defects total (CFD delta) CFD delta = No. of customer-found defects caused by incremental s/w dev. Assembly-equivalent total source size
Goal 5: Improve customer service Question 5.1: What is the number of new problems that were opened during the month? Metric 5.1: New Open Problems (NOP) NOP = Total new postrelease problems opened during the month Question 5.2: What is the number of open problems at the end of the month? Metric 5.2: Total Open Problems (TOP) TOP = Total new postrelease problems that remain open at the end of the month
Goal 5: Improve customer serviceContd… Question 5.3: What is the mean age of open problems at the end of the month? Metric 5.3: Mean Age of Open Problems (AOP) AOP = (Total time post-release problems remaining open at the end of the month have been open)/(Number of open post- release problems remaining open at the end of the month) Question 5.3:What is the mean age of problems that were closed during the month? Metric 5.3: Mean Age of Closed Problems (ACP) AOP = (Total time post-release problems closed within the month were open)/(Number of open post-release problems closed within the month)
Goal 6: Reduce cost of nonconformance Question 6.1: What was the cost to fix postrelease problems during the month? Metric 6.1: Cost of Fixing Problems (CFP) CFP = Dollar cost associated with fixing postrelease problems within the month
Goal 7: Increase software productivity Question 7.1: What was the productivity of software development projects (based on source size)? Metric 7.1a: Software Productivity total (SP total) SP total = Assembly-equivalent total source size Software development effort Metric 7.1b: Software Productivity delta (SP delta) SP total = Assembly-equivalent delta source size Software development effort
Daskalantonakis also described additional in-process metrics that can be used for schedule, project, and quality control Life-cycle phase and schedule tracking metric: Track schedule based on life-cycle phase comparing actual to plan. Cost/earned value tracking metric: Track actual cumulative cost of the project versus budgeted cost, and actual cost of the project so far, with continuous update throughout the project. Requirements tracking metric: Track the number of requirements change at the project level. Design tracking metric: Track the number of requirements implemented in design versus the number of requirements written. Fault-type tracking metric: Track fault cause.
Remaining defect metrics: Track faults per month for the project and use Rayleigh curve to project the number of faults assumed to be found in the months ahead development. Review effectiveness metric: Track error density by stages of review and use control chart methods to lag the exceptionally high or low data points.
HEWLETT-PACKARD Software Metrics: Establishing A Company – Wide Program by Grady and Caswell (1986) The book lists primitive and computed metrics widely used at HP. Primitive Metrics are those that are directly measurable and accountable such as token, data token, defect, total operands, LOC, and so forth. Computed Metrics are metrics that are mathematical combinations of two or more primitive metrics e.g. Average fixed defects/working day Average engineering hours/fixed defect Average reported defects/working day
Bang: “a quantitative indicator of net usable function from the user’s point of view”. Two methods for computing Bang i. For function-strong systems, involves counting the tokens entering and leaving the function multiplied by the weight of the function. ii. For data-strong systems, involves the objects in the database weighted by the number of relationships of which the object is a member. Branches covered/total branches: when running a program, this metric indicates what percentage of the decision points were actually executed. Defects/KNCSS ----- end-product quality metrics
Defects/LOD ----- end-product quality metrics where LOD – Lines of documentation not included in program source code, and KNCSS – Thousand non-comment source statements. Defects/testing time --- Design weight: “Design weight is a simple sum of the module weights over the set of all modules in the design” NCSS/engineering month ---- productivity measure Percent overtime: average overtime/40 hours per week (Phase) engineering months/total engineering months
IBM Rochester IBM Rochester uses corporate 5-UP software quality metrics defined by the “IBM corporate software measurement council”. Overall customer satisfaction as well as satisfaction with the CUPRIMDS parameters Post-release defect rate for three-year LOP tracking: TVUA/MSST based on the release the defects are reported. Customer problem calls Fix response time Number of defective fixes
In addition to 5-UP metrics other product quality metrics and many in-process metrics are also used. TVUA/KSSI based on whether the release contains the defects or not (regardless of which reported release) for 4 year LOP tracking TVUA/KSSI based on release origin for 4 year LOP tracking Customer reported problems per user month Backlog management index Postrelease arrival patterns for defects and problems (both defects and non-defect-oriented problems) Defect removal model for the software development process with target defect removal rate for each phase
Phase effectiveness (for each phase of inspection and test) Inspection coverage, effort, and defect rates In-process inspection escape rate Compile failures and build/integration defects Driver stability index Weekly defect arrivals and backlog during testing Defect severity Defect cause
Reliability: mean time to initial program loading (IPL) during test Models for post-release defect estimation S curves for project progress comparing actual to plan for each phase of development such as number of inspections conducted by week, LOC integrated by week, number of test cases attempted and succeeded by week, and so forth.