Download
1 / 27
270 likes | 287 Vues
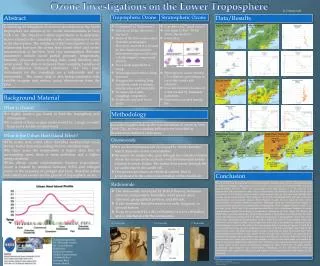
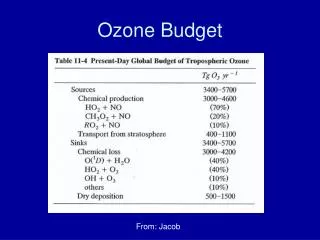
This critical review explores the sources, sinks, and budget of ozone in the troposphere, focusing on its impact on human health, vegetation, and climate. The review delves into historical background, ozone dynamics, and the contributions of factors like biomass burning. It discusses the evolution of the tropospheric ozone budget over the next 20 years and highlights the role of various ozone formation mechanisms. Detailed analyses of ozone chemistry across different atmospheric layers are presented, along with the implications of ozone pollution on human health and ecosystems. The review also addresses the challenges and opportunities in mitigating ozone-related issues.

E N D
First Draft Review Chapter 1Critical review on the sources, sinks and budget of ozone in the troposphere Yasin Elshorbany Chapter Writing Team: A. T. Archibald., Y. Elshorbany, M. Coyle, R. Derwent, A. Finco, I. Galbally, G. Gerosa, P. Griffiths, R. Hossaini, L. Hu, A. Lefohn, M. Naja, J. Neu, S. Oltmans, A. Saiz-Lopez, P. Saxena, M. G. Schultz, I. Shahid, D. Shallcross, T. Wallington, T. Wang, H. Worden, P. Young
Chapter 1 Layout Original Layout Formatted as book/report type review, which allows for greater details. 2 New / projected layout (based on Owen’s suggestion) To be reformatted as a review paper and to address a targeted scientific question. i.e, the paper will be focused around this questions. For example, Owen suggested: How is the global tropospheric ozone budget likely to evolve over the next 20 years? Obviously, several parts of the original layout will be used in the new one.
Original 1 Layout Historical Background The Sources and Sinks of Tropospheric O3 The Dynamics of Ozone in the Troposphere Impacts of Tropospheric Ozone on Human Health, Vegetation and Climate Summary
Historical Background Chronological description of ozone story. For example, it describe the early discovery of ozone in 1839 (Schönbein 1845), first ozone long measurements (Fabry, 1950), stratospheric ozone by Regener (1938), tropospheric ozone by Haagen-Smit, 1954. Include also the first Levy model (9 primary chemical reactions).
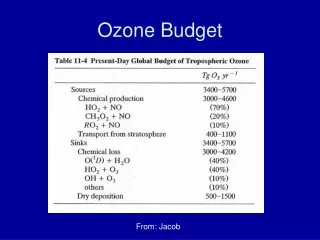
The Sources and Sinks of Tropospheric O3 • Ozone Photochemical Formation • The role of Nitryl chloride photolysis in ozone formations • The contribution of biomass burning to ozone formations • Diagnostics of ozone production and loss • Ozone Production Efficiency (OPE) • Controlling ozone – VOC reactivity • Model budgets of tropospheric ozone – consensus over time
Alkenes + O3 O3 + hv HCHO + hv HONO + hv OH VOC RO2 O2 Ozone formation reactions O3 hu O2 NO2 NO HO2 carbonyl product(s) RO rxn with O2, decomposition or isomerisation. NO NO2 O2 hu O3 P(O3) = [NO] {k [HO2]+ ∑ ki[RO2i]}
The role of Nitryl chloride photolysis in ozone formations HCl(aer)+N2O5(g) het→ ClNO2(g)+HNO3(aq) ClNO2 + hν → Cl · + NO2 • Measured mixing ratios of ClNO2 and N2O5 and the Cl atom production rate resulting from the photolysis of ClNO2 on 2 September 2006, while the ship was stationary in an inlet off Galveston Bay. • Master chemical mechanism results for a representative modestly polluted marine air mass, to which 650 and 1,500 p.p.t.v. of ClNO2 have been added. Note that b is not intended as a model for the specific conditions in a, but rather to provide a general representation of the effect of ClNO2 chemistry, adopted from Osthoff et al. 2008).
The Contribution of Biomass Burning to Ozone Formations Global and regional estimates of O3 production from wildfires. Adopted from Jaffe and Wigder, 2012
The Dynamics of Ozone formation • Ozone chemistry in the urban boundary layer (update text?) • Ozone chemistry in the free troposphere (text?) • Wintertime Ozone Chemistry (update text?) • Ozone chemistry in polar boundary layer (text?) • Ozone chemistry over the marine boundary layer – the role of halogens (text?) • Ozone chemistry over tropical forests (text?)
Wintertime Ozone Photochemical Production Diurnal photochemical production of ozone during air temperatures as low as -17 ºC, in the rural Upper Green River Basin, Wyoming, in the vicinity of the Jonah–Pinedale Anticline natural gas field. They found that hourly average ozone concentrations rise from 10–30 p.p.b. at night to >140 p.p.b. Ozonesonde profile 10 km north of the gas field showing ozone and temperature profiles, surface to 2,600 m, 21 February 2008. Adopted from Schnell et al., 2009. Upper Green River Basin, Wyoming, in the vicinity of the Jonah–Pinedale Anticline natural gas field. Adopted from Joseph Pinto, 2009. JENNIFER FRAZIER, WDEQ
Wintertime Ozone Photochemical Production Time series of the measured and modeled hourly O3 mixing ratios at Horse Pool in (a) 2012 and (b) 2013. Adopted from Ahmadov et al., 2015, understanding high wintertime ozone pollution events in an oil- and natural gas-producing region of the western US
Impacts of Tropospheric Ozone on Human Health, Vegetation and Climate • Ozone impacts on human health(Text?) • Ozone driven vegetation damage (Text updates?) • Ozone as a greenhouse gas(Text updates?)
Changes in Gross Primary Productivity between 1901-2100 due to O3 effects at fixed pre-industrial [CO2] under low (c) and high (d) ozone plant sensitivity. Recent work in India (Ghude et al., 2014) suggests that the current levels of O3 present across the country lead to losses of ~10%, enough to feed ~ 94 million people. Ozone driven vegetation damage
Clear-sky ozone top-of-atmosphere (TOA) long-wave radiative effect (LWRE) (W/m2) measured by Infrared Atmospheric Sounding Interferometer (IASI)15 April, 2011 shows the spatial variability in the greenhouse effect of ozone . Ozone as a greenhouse gas
New Layout (draft to be discussed) Introduction Ozone Photochemical Formations and Dynamics Impacts of Tropospheric Ozone on Human Health, Vegetation and Climate Ozone evolution in the last decades based on model and observations studies Future scenarios for ozone evolution. Also, how non-linear chemistry may impact climate and how climate feedbacks on ozone (e.g., via changes in Temp.), both one- and two-way feedbacks. In the above two sections, the ozone evolution can be discussed in terms of its chemical formation/chemical regimes/OPE and dynamics, so, some sections from the old format may be incorporated here. How uncertainties in known/unknown chemistry and emission may affect the current and projected ozone evolution. Executive Summary to Policy makers Summary
The ensemble ACCMIP projection for surface ozone indicates an increase of 2 ppbv across the North Pacific Ocean during 2000-2030 based on a business as usual RCP8.5 emissions scenario. Young et al. (2013), Pre-industrial to end 21st century projections of tropospheric ozone from the Atmospheric Chemistry and Climate Model Intercomparison Project (ACCMIP), ACP.
A recent study presented at the AGU 2015 Fall Meeting, and soon to be submitted to Nature Geoscience, indicates that half of the tropospheric ozone burden increase since 1980 is due to increases in emissions. The other half of the increase is due to emissions shifting equatorward where ozone production efficiency is much greater. This finding is of major importance and implies that even if ozone precursor emissions do not increase globally over the coming years, ozone will still increase globally if the emissions continue to shift equatorward. Top left – increase in global tropospheric ozone burden over 1980-2010 due to the actual increase in emissions and the actual equatorward shift in emissions. Top right - increase in global tropospheric ozone burden over 1980-2010 when 1980 emissions are given the 2010 spatial distribution, i.e equatorward shift. Bottom left - increase in global tropospheric ozone burden over 1980-2010 when emissions are allowed to increase but are kept in their 1980 locations. Bottom right - increase in global tropospheric ozone burden over 1980-2010 due to methane increases alone. Zhang, Y., O. R. Cooper and J. J. West (2016), Southward redistribution of emissions dominates the 1980 to 2010 tropospheric ozone change, in preparation for Nature Geoscience.
If this science question is adopted for the paper: “How is the global tropospheric ozone budget likely to evolve over the next 20 years?” …and if we believe the world is on track to follow the RCP8.5 scenario and that the ozone burden will likely increase, then the paper would address the following aspects of the ozone budget: Stratospheric source: what is the most likely estimate of the present day flux of ozone from the stratosphere into the troposphere, and do we expect this component of the ozone budget to increase over the next 20 years? Ozone production: What is the most likely estimate for present day ozone production and how do we expect production to change over the next 20 years? Ozone loss: What is the most likely estimate for present day ozone loss and how do we expect loss to change over the next 20 years? Emissions (anthropogenic and biomass burning)…same approach as above This approach allows us to review all the important processes related to emissions, STE, production and loss, but also allows us to look forward and give our best assessment of what is most likely to unfold.
Given the following: • Methane is increasing globally • fossil fuel combustion is increasing globally (and perhaps NOx emissions as well) • Emissions are shifting equatorward where ozone production efficiency is greater • Of the 4 RCP scenarios, we appear to be following RCP8.5 • Therefore, we should expect an increase in the tropospheric ozone burden. • Next, let’s look at ozone observations and see if this is indeed the case….
Ozone has increased steadily since 1974 at the rate of 0.16 ppbv yr-1. Applying this rate of increase to 2000-2015 yields an ozone increase of ~2 ppbv. This equals the ACCMIP projected increase in surface ozone over the North Pacific Ocean for the 2000-2030 time period (for RCP8.5). So the ACCMIP projection has come true in just 15 years, rather than 30. 95% 67 % 50% 33% 5 % Annual mean ozone has increased by 17% during 1974-2014. Data collected by NOAA Global Monitoring Division
The figure to the right shows Jerry Ziemke’s OMI/MLS tropospheric ozone product updated for October 2004 through December 2015. Thin lines indicate monthly values and thick lines are 12-month running means. The global tropospheric ozone burden has increased significantly by 9% during 2005-2015. The trend is significant in both hemispheres.
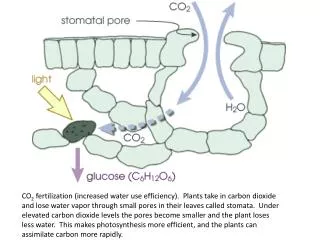
Introduction Ozone Tropospheric Chemistry • Ozone photostationary state • Ozone formation reactions • Ozone suppression reaction • Ozone control strategy
Introduction Ozone photostationary state (Lighton, 1961) • NO + O3 → NO2 + O2 • NO2 + h (l ≤ 420 nm)→ O(3P) + NO • O(3P) + O2 (M) → O3 (M) • [O3] = jNO2 [NO2] / KNO+O3 [NO] However, this is a do-nothing cycle as long as (new) ozone formation is concerned.
Introduction Ozone suppresion Under low NOx conditions: • HO2 + HO2 → H2O2 + O2 • HO2 + RO2 → ROOH + O2 • RO2 + RO2 → Products Ozone may be even also destroyed due to its reaction with HO2: • HO2 + O3 → OH + 2O2 Under high NOx conditions: • OH + NO2 + M → HNO3 +M
Introduction Ozone Control Strategy “how much reductions in VOC or NOx or both would be required to reduce the peak O3 concentrations to the air quality standards” • Ozone sensitivity • Determine the chemistry of the air matrix as VOC-sensitive or NOx-sensitive. • Ozone formation potential Determine the contribution of the different VOCs to the ozone formation considering their kinetic and mechanistic point of view. Yasin Elshorbany Physikalische Chemie