Download
1 / 27
280 likes | 463 Vues
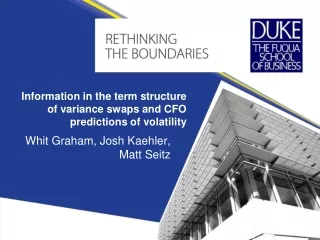
On the Term Structure of Model-Free Volatilities and Volatility Risk Premium. Kian Guan LIM and Christopher TING Singapore Management University. Motivations on Volatility. Volatility forecast is critical to stock and option pricing Historical volatilities Implied volatilities

E N D
On the Term Structure of Model-Free Volatilitiesand Volatility Risk Premium Kian Guan LIM and Christopher TING Singapore Management University
Motivations on Volatility • Volatility forecast is critical to stock and option pricing • Historical volatilities • Implied volatilities • Model-free volatility • Term Structures • Volatility Risk • Is it priced? Term structure? • Industry Development • CBOE VIX “Fear” gauge • Variance and volatility swaps • Options and futures on volatility indexes
Main ideas of paper • Present an enhanced method to compute model-free volatility more accurately • Enable the construction of the term structure of model-free volatilities from 30- to 450-day constant maturities • Explore the longer term structure of model-free volatility • Gain further insight into the volatility risk premium
Theory • Expected variance from time 0 (today) to T under risk-neutral measure Q • The volatility s is the forward-looking volatility forecast • Proposition 1 Call price Put price Risk-free rate rassumed constant
Generalized Diffusion Process • Their difference is second-order m and n are not necessarily constant, but may depend on other adapted state variables
Integrated Variance • Total variance from time 0 to T
Derivation Log(1+z) < z Necessarily positive
Option price Call Put X F0 A Pictorial Presentation • Area under the two curves defined by the intersection point • Implied forward price F0 determined by put-call parity D is the sum of dividends
some technical problems • Discrete price grid • Cannot be smaller than $0.01 • Discrete strike price interval • Minimum interval • Limited range of strike prices • Bid-offer spread • Use a correct price to avoid arbitrage • Thin volume • Far term options
Discretized Approximation • Average of Riemann upper sum and lower sum
In overcoming approx due to discrete strike price • Cubic Splines • No risk-free arbitrage conditions as constraints • Volume as weight • Piece-wise integration - Closed-form
Data from Optionmetrics • CBOE S&P 100 index option • European style • Re-introduced on July 23, 2001 • March quarterly cycle • Minimum strike interval 5 points • Near term, out-of-the money, 10 or 20 points strike intervals • Far term, 20 points strike intervals • 7 to 8 terms for any given trading day • Weekly options excluded • Sample period • July 23, 2001 through April 30, 2006
Descriptive Statistics • Daily average
Interpolation and Extrapolation are critical • The discretized approximation formula leads to an upward estimate of model-free volatility • The market volatility indexes might have an upward bias, especially for those that have a larger strike price interval • Variance swap buyers may be paying for the bias
Exact versus Approximate • The difference d = a - e* • Relative size of strike price interval • Relative size: 5 points/S&P 100 index level • d1: sub-sample defined by relative size smaller than median value • d2: sub-sample defined by relative size larger than median
Volatility Term Structure • Constant maturity • Range of values over the sample period is smaller the longer is the constant maturity
Term Structures of Volatility Changes • Absolute changes of daily volatility less drastic the longer the constant maturity Run Table3.m
Term Structure of Fear Gauges • Daily change in model-free volatility ti and daily change in S&P 100 index level Lt are negatively correlated – volatility rises lead to stock market falls. Second column is autocorrelation in ti Run Table6.m
Asymmetric Correlations: Lt = c0+c1t++c2t-+t larger magnitude of equity when short-term volatility increases than when it decreases larger magnitude of equity when long-term volatility drops than when it increases
Change of Volatility Correlations with Index Returns • Shorter constant maturity • Higher correlation with a market decline • Consistent with Whaley (JPM,2000) – short-term volatility spike bad for short-term investors • Longer constant maturity • Higher correlation with a market rise • Quite surprising
Slope Estimate An example of a single day regression of (T) on T. 61.6% of all daily regressions produces positive slopes
Term Structure of Slope Estimates upward sloping volatility term structure corresponds with positive stock returns & lower risk • Upward sloping (737 estimates) downward sloping volatility term structure corresponds with negative stock returns & higher risk • Downward sloping (460 estimates)
This Figure plots the daily time series of S&P 100 index in Panel A and the slope estimates of the model-free variance term structure in Panel B. The horizon axis shows the dates in yymmdd. The sample period is from July 2001 through April 2006. Change in slope estimates is positively correlated with the change in index level
variance risk premium • variance swap (a forward contract) buyer’s payoff is (R2 - 2) x Notional Principal where R2 is realized annualized volatility computed over contract maturity [0,T] from daily sample return volatility and model-free 2 over [0,T] is the strike under fair valuation at start of contract t=0. • Mean excess return (R2 - 2)/ 2 may be construed as volatility risk premium that the buyer is compensated for taking the risk.
Variance Swap Payoff and Return for Buyers • Volatility risk premium $ % asymmetric larger gains at right skew and lower loss at left skew up to 180 days increasing maturity
Conclusions • An enhanced method to construct term structure • Hopefully a better understanding of the behavior of a long term structure of volatility • Look at a number of asymmetric effects • Explore term structure of variance risk premium • Validation of mean-reverting stochastic volatility Uncompleted Tasks • how to check term structure using other long-life traded instruments • how to make sense of the explored term structure effects in trading and hedging strategies • more rigorous statistical confirmations of the term structure results