Weight for Height
BPK 303. Weight for Height. Summer 2014. Desirable Body Weight. Desirable, ideal, optimal “What weight should I be?” Weight for height Weight for height with frame size Weight with optimal % body fat BMI - Body Mass Index. Weight for Height. Epidemiologists needed a measure of obesity

Weight for Height
E N D
Presentation Transcript
BPK303 Weight for Height Summer 2014
Desirable Body Weight • Desirable, ideal, optimal • “What weight should I be?” • Weight for height • Weight for height with frame size • Weight with optimal % body fat • BMI - Body Mass Index
Weight for Height • Epidemiologists needed a measure of obesity • Often questionnaire data on height and weight alone • “Ideal” and “Desirable” Weight tables • Metropolitan Life Weight for Height Tables
Weight for Height Tables Metropolitan Insurance Co., 1983, weights at ages 25-59 based on lowest mortality. Weight in pounds according to frame (in indoor clothing weighing 3 lbs., shoes with 1" heels).
Frame Size Estimate of Skeletal Proportion
Weight for Optimal % Body Fat • If you know the current % body fat, weight for any optimal % body fat can be calculated. Consensus of an expert panel (1986). Arbitrary cut-off points.
Calculation of optimal weight range • 1. Calculate Fat Weight (FW) • FW = body weight x Ft • Where Ft = fractional expression of % body fat • 2. Calculate Fat-Free Weight (FFW) • FFW = Body Weight – FW • 3. Calculate the desired target weight (TW) • TW = FFW / (1 – Fx) • Where Fx = fractional expression of % body fat
Example Calculation: Young Male Current weight =100kg, %body fat = 34% • 1. Calculate Fat Weight (FW) • FW = body weight x Ft • FW = 100 x .34 = 34kg • 2. Calculate Fat-Free Weight (FFW) • FFW = Body Weight – FW • FFW = 100 – 34 =66kg • 3. Calculate the desired target weight (TW) • TW = FFW / (1 – Fx) • @ 12%; TW = 66 / (1 - .12) = 66 / 0.88 = 75kg • @ 18%; TW = 66 / (1 - .18) = 66 / 0.82 = 80.5kg
Weight range taking into account error in determination of % body fat • 95% confidence estimates of % body fat • % Fat (1.96 x S.E.E.) • 34 (1.96 x 3.7) = 26.7 to 41.3% body fat • 95% confidence estimates of FFW are: • upper limt FFW = 100 – 26.7 = 73.2kg • lower limit FFW = 100 – 41.3 = 58.7kg • Lower limit for target weight at 12% body fat • TW = 58.7 / (1 - .12) = 58.7 / 0.88 = 71.6kg • Upper limit for target weight at 18% body fat • TW = 73.2 / (1 - .18) = 73.2 / 0.82 = 83.2kg
Body Mass Index (Quetelet Index - 1833)
Quetelet (1833) • Tall adults are more linear than short adults. • Fully developed individuals: the weight of an individual at different heights is related to the square of the stature: [WT] = HT2 • During development: the squares of weight were related to the fifth powers of height: [WT]2 = HT5 → [WT] = HT2.5
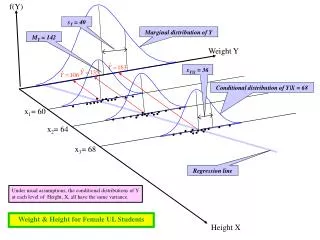
Correlational Analysis of Weight (WT) and Height (HT) indices in a sample of SFU Kin 303 students (aged 18–25 years) Ward R, Anderson G. 2012 (unpublished)
Ross et al. 1988 • Correlations of BMI are “good”with sum of skinfold corrected-girths and even bone widths
Correlational Analysis of Weight (WT) and Height (HT) indices in a sample of SFU Kin 303 students (aged 18–25 years) Ward R, Anderson G. 2012 (unpublished)
Percentage body fat as measured by dual-energy X-ray absorptiometry (DXA %fat) versus BMI and 1/BMI in women from 3 study sites combined. Reproduced from Gallagher (2000)
Percentage body fat by dual-energy X-ray absorptiometry (DXA %fat) versus 1/BMI by sex for each of the study sites. Reproduced from Gallagher (2000)
Predicted percentage body fat by sex and ethnicity based on 4-C percentage body fat
Children & Youth During development: the squares of weight were related to the fifth powers of height: [WT]2 = HT5 → [WT] = HT2.5
B-values of height predicting weight in yearly age groups for Canada Fitness Survey (CFS) and Coquitlam Growth Study (COGRO) boys and girls
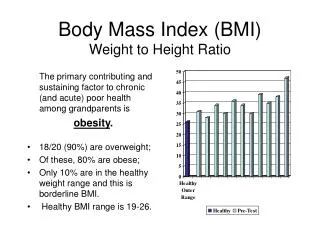
BMI • BMI is not an indicator of body fat in individuals it is a measure of weight for height • It can be useful as a population screening and awareness device, but not in individual prescription • May be useful used in conjunction with other measures