Height and Weight
Height and Weight. Presented by Clarence Cheng & Kehinde Opere. Hypotheses – Height (z- and t-tests). Lower 1–tail test Null hypothesis H o : the average height for 2004 SCSU SDP students is not significantly different from 169 cm

Height and Weight
E N D
Presentation Transcript
Height and Weight Presented by Clarence Cheng & Kehinde Opere
Hypotheses – Height (z- and t-tests) • Lower 1–tail test • Null hypothesis Ho: the average height for 2004 SCSU SDP students is not significantly different from 169 cm • Alternative hypothesis Ha: the average height is less than 169 cm Or… • H0: μh = 169 cm • Ha: μh < 169 cm • Upper 1–tail test • Null hypothesis Ho: see above • Alternative hypothesis Ha: the average height is greater than 169 cm Or… • H0: μh = 169 cm • Ha: μh > 169 cm
Hypotheses – Height cont. (z- and t-tests) • 2–tail test • Null hypothesis H0: see above • Alternative hypothesis Ha: the average height is not 169 cm Or… • H0: μh = 169 cm • Ha: μh ≠ 169 cm • α = .05, or 5% (this will apply to all following slides)
Testing… (z) • 1-Tail: • zα = 1.645 for upper 1-tail test and -1.645 for lower 1-tail test • z = (xbar – μ)/(s/√n) ≈ .2093 • Because -1.645 < .2093 < 1.645, H0 can be accepted as true for both the upper and lower 1-tailed z tests. • In other words, with a 5% chance of committing a Type I error, the average height of 2004 SCSU SDP students is not significantly different from 169 cm. • To avoid repetition, the preceding conclusion will not be printed on other slides in this presentation with the title Testing…
Testing… (z) • 2-Tail: • zα = 1.96 for 2-tail test • z = (xbar – μ)/(s/√n) ≈ .2093 • Because -1.96 < .2093 < 1.96, H0 can be accepted as true for the 2-tailed z test.
Testing… (t) • 1-Tail: • tα = 1.782 for upper 1-tail test and -1.782 for lower 1-tail test • t = (xbar – μ)/(s/√n) ≈ .2093 • Because -1.782 < .2093 < 1.782, H0 can be accepted as true for both the upper and lower 1-tailed t tests.
Testing… (t) • 2-Tail: • tα = 2.179 for 2-tail test • t = (xbar – μ)/(s/√n) ≈ .2093 • Because -2.179 < .2093 < 2.179, H0 can be accepted as true for the 2-tailed t test.
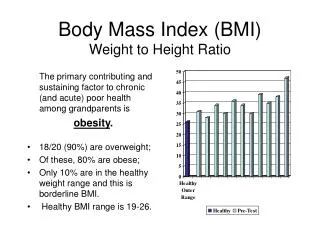
Descriptive Statistics – Height • Mean: 169.4615 • Median: 170 • Mode: 170 • Range: 30 • Standard Deviation: 7.9516
Hypotheses – Weight (z- and t-tests) • Lower 1–tail test • Null hypothesis H0: the average weight (in kg) for 2004 SCSU SDP students is not significantly different from 72 kg • Alternative hypothesis Ha: the average weight is less than 72 kg Or… • H0: μw = 72 kg • Ha: μw < 72 kg • Upper 1–tail test • Null hypothesis H0: see above • Alternative hypothesis Ha: the average weight is more than 72 kg Or… • H0: μw = 72 kg • Ha: μw > 72 kg
Hypotheses – Weight cont. (z- and t-tests) • 2-tail test • Null hypothesis H0: see above • Alternative hypothesis Ha: the average weight is not 72 kg Or… • H0: μw = 72 kg • Ha: μw ≠ 72 kg
Testing Again… (z) • 1-Tail: • zα = 1.645 for upper 1-tail test and -1.645 for lower 1-tail test • z = (xbar – μ)/(s/√n) ≈ -.7736 • Because -1.645 < -.7736 < 1.645, H0 can be accepted as true for both the upper and lower 1-tailed z tests. • In other words, with a 5% chance of committing a Type I error, the average weight of 2004 SCSU SDP students is not significantly different from 72 kg. • To avoid repetition, the preceding conclusion will not be printed on other slides in this presentation with the title Testing Again…
Testing Again… (z) • 2-Tail: • zα = 1.96 for 2-tail test • z = (xbar – μ)/(s/√n) ≈ .2093 • Because -1.96 < .2093 < 1.96, H0 can be accepted as true for the 2-tailed z test.
Testing Again… (t) • 1-Tail: • tα = 1.782 for upper 1-tail test and -1.782 for lower 1-tail test • t = (xbar – μ)/(s/√n) ≈ -.7736 • Because -1.782 < -.7736 < 1.782, H0 can be accepted as true for both the upper and lower 1-tailed t tests.
Testing Again… (t) • 2-Tail: • tα = 2.179 for 2-tail test • t = (xbar – μ)/(s/√n) ≈ -.7736 • Because -2.179 < -.7736 < 2.179, H0 can be accepted as true for the 2-tailed t test.
Descriptive Statistics – Weight • Mean: 69.0546 • Median: 65.4 • Mode: N/A • Range: 36.82 • Standard Deviation: 13.7280
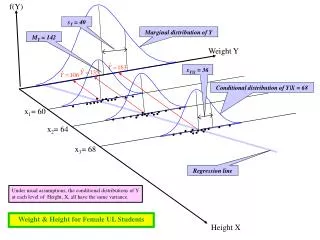
A Graph Height vs. Weight – Scatterplot
Another Graph Height vs. Weight – Line Graphs
So, What Did That Mean?(the graphs) • The scatterplot shows there is basically no correlation between height and weight. The points are for the most part evenly spread. Thus, height and weight are likely not related. • The line graphs are further support for this notion, as the graphs tend to increase and decrease both simultaneously and inversely, showing they are independent of each other. • The correlation coefficient for the two data sets is .0459 – this demonstrates the little correlation between height and weight as well.
Note… Calculations of means, medians, modes, ranges, standard deviations, and z and t values and the making of the graphs were done in Microsoft Excel.