Download
1 / 13
130 likes | 169 Vues
Explore adoption rates of minimum tillage in Zambia using district-level data from 2008-2012, identifying drivers and variations. Discover low national use rates and potential for improvement through support measures.

E N D
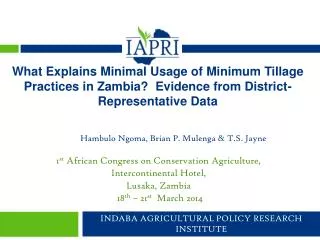
Minimum Tillage Use Rates in Zambia: Evidence from District-Representative Data Hambulo Ngoma, Brian P. Mulenga, T.S. Jayne, Nicholas Sitko, Jordan Chamberlin, & Stephen Kabwe Agriculture Cooperating Partners Meeting on Conservation Agriculture, Embassy of Finland, Lusaka, Zambia 10th June 2014 Indaba Agricultural Policy Research Institute
Motivation • Wide differences in MT adoption/use rates reported in existing studies • Most of the existing studies are based on targeted population, specific regions, small samples, & only provide a snapshot • Our analysis uses nationally representative agric. dataset, Crop Forecast Survey (CFS) spanning 5 years (2008-2012) to examine trends of MT use at different levels, & determine drivers of use, & identify sources of variation in reported estimates
Data • CFS data, statistically representative at district and national levels; 2008–2012, with a total of 63,000 households over the 5 years • FGDs in 3 districts with 69 farmers • Key informant interviews with CFU project staff, MAL extension officers and researchers • Literature review • CFS collected data using semi-structured questionnaire on: • Demographics, landholding, field size & use • Main tillage method used in each field basis for our estimates
Methods • Descriptive analysis used to generate trend tables and graphs • Used econometric model to determine factors influencing MT use
1. MT use rates low (<5%) nationally but rising 2. MT use higher than national averages in areas of intense CF promotion
Understanding low use rates FGDs & Key informant interviews: • Provision of “material handouts” to “lure” farmers • High labor demands • Dry season land preparation conflicts with off-farm activities e.g. marketing, & trading • Resource constraint • poor resource farmers may not afford purchased inputs e.g herbicides • Scarcity of ripping services for hire
Drivers of MT use after controlling for other factors • Increased land access improves uptake of basins and ripping practices • Following a drought season, farmers increase MT use • Following season of floods farmer use of MT reduces • response to rainfall variability • Incidences of cattle diseases negatively affect uptake of ripping, and ADP in general • Presence of CFU in a district positively influences uptake of ripping
What Explains Variations in Adoption/Use Rates • Two plausible explanations: • Sampling design • Variable(s) of interest (question asked)
Main Conclusions • We find low but rising use rates nationally < 5% as at 2012 • There is potential to increase MT uptake as indicated by areas of longstanding intensive promotion • Farmers with relatively large landholdings more likely to adopt/use MT • More support needed to collection and dissemination of weather data • Cattle diseases control need to be ramped up and promotion of tractor ripping services • Findings differ mainly due to varying sample frame, & variable of interest • Joint study by stakeholders is necessary to harmonize the sample frame, & definitions
THANK YOU Source: CFU
IAPRI WEBSITE/ADDRESS http://www.iapri.org.zm/ Or http://www.aec.msu.edu/fs2/zambia/index.htm Plot No. 26A Middleway Road, KabulongaPostNet Box 99, KabulongaLusaka, ZambiaTel: +260 211 261194/97 Fax: +260 211 261199