Download

1 / 44
440 likes | 545 Vues
This study explores advanced techniques for image-based segmentation of corridor floors to enhance the navigation capabilities of mobile robots. It discusses previous methods such as free space and floor detection using optical flow and stereo homographies, highlighting their limitations. The authors propose a score model for evaluating detected line segments, including structure, bottom, and homogenous scores. The Douglas-Peucker Algorithm is employed for line simplification, improving computational efficiency. Experimental results validate the effectiveness of the proposed methods in real-world environments.

E N D
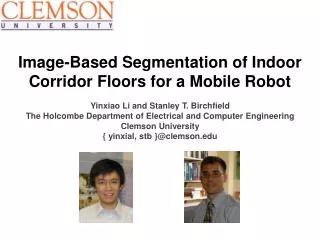
Image-Based Segmentation of Indoor Corridor Floors for a Mobile Robot Yinxiao Li and Stanley T. Birchfield The Holcombe Department of Electrical and Computer Engineering Clemson University { yinxial, stb }@clemson.edu
Typical Corridor Images Low contrast Common Reflections Specular Reflections
Outline • Previous work • Detecting Line Segments • Score model for Evaluating Line Segments • Structure Score • Bottom Score • Homogenous Score • Experimental Results • Conclusion
Outline • Previous work • Detecting Line Segments • Score model for Evaluating Line Segments • Structure Score • Bottom Score • Homogenous Score • Experimental Results • Conclusion
Previous Work Free space detection Floor detection Previous approaches Apply planar homographies to optical flow vectors (Kim 2009, Zhou 2006) Stereo homographies (Fazl-Ersi 2009) Geometric reasoning (Lee 2009) Limitations Assume ceiling visible Computational efficiency Calibrated cameras Previous approaches • Stereo Matching (Sabe 2004) • Optical Flow (Stoffler 2000, Santos-Victor 1995 • Combination of color and histogram (Lorigo 1997) Limitations • Need motion • require different colors for floor and wall • Computational efficiency • Calibrated cameras
Outline • Previous work • Detecting Line Segments • Score model for Evaluating Line Segments • Structure Score • Bottom Score • Homogenous Score • Experimental Results • Conclusion
Douglas-Peucker Algorithm • An algorithm that: • Reduces the number of points in a curve that is approximated by a series of points • Focus on maximum distance between the original curve and the simplified curve • Finds a similar curve with fewer points http://en.wikipedia.org/wiki/Ramer%E2%80%93Douglas%E2%80%93Peucker_algorithm David Douglas & Thomas Peucker, "Algorithms for the reduction of the number of points required to represent a digitized line or its caricature", The Canadian Cartographer 10(2), 112–122 (1973)
Douglas-Peucker Algorithm • An algorithm that: • Reduces the number of points in a curve that is approximated by a series of points • Focus on maximum distance between the original curve and the simplified curve • Finds a similar curve with fewer points http://en.wikipedia.org/wiki/Ramer%E2%80%93Douglas%E2%80%93Peucker_algorithm David Douglas & Thomas Peucker, "Algorithms for the reduction of the number of points required to represent a digitized line or its caricature", The Canadian Cartographer 10(2), 112–122 (1973)
Douglas-Peucker Algorithm • An algorithm that: • Reduces the number of points in a curve that is approximated by a series of points • Focus on maximum distance between the original curve and the simplified curve • Finds a similar curve with fewer points http://en.wikipedia.org/wiki/Ramer%E2%80%93Douglas%E2%80%93Peucker_algorithm David Douglas & Thomas Peucker, "Algorithms for the reduction of the number of points required to represent a digitized line or its caricature", The Canadian Cartographer 10(2), 112–122 (1973)
Douglas-Peucker Algorithm • An algorithm that: • Reduces the number of points in a curve that is approximated by a series of points • Focus on maximum distance between the original curve and the simplified curve • Finds a similar curve with fewer points http://en.wikipedia.org/wiki/Ramer%E2%80%93Douglas%E2%80%93Peucker_algorithm David Douglas & Thomas Peucker, "Algorithms for the reduction of the number of points required to represent a digitized line or its caricature", The Canadian Cartographer 10(2), 112–122 (1973)
Douglas-Peucker Algorithm • An algorithm that: • Reduces the number of points in a curve that is approximated by a series of points • Focus on maximum distance between the original curve and the simplified curve • Finds a similar curve with fewer points http://en.wikipedia.org/wiki/Ramer%E2%80%93Douglas%E2%80%93Peucker_algorithm David Douglas & Thomas Peucker, "Algorithms for the reduction of the number of points required to represent a digitized line or its caricature", The Canadian Cartographer 10(2), 112–122 (1973)
Douglas-Peucker Algorithm • An algorithm that: • Reduces the number of points in a curve that is approximated by a series of points • Focus on maximum distance between the original curve and the simplified curve • Finds a similar curve with fewer points http://en.wikipedia.org/wiki/Ramer%E2%80%93Douglas%E2%80%93Peucker_algorithm David Douglas & Thomas Peucker, "Algorithms for the reduction of the number of points required to represent a digitized line or its caricature", The Canadian Cartographer 10(2), 112–122 (1973)
dallowed Modified Douglas-Peucker Algorithm original algorithm: dallowed is constantmodified algorithm: dallowed is given by half-sigmoid function original modified
Detecting Line Segments (LS) Compute Canny edges
dallowed Detecting Line Segments (LS) • Compute Canny edges • Modified Douglas-Peucker algorithm to detect line segments • Vertical LS: slope within ±5° of vertical direction • Horizontal LS: Slope within ±45° of horizontal direction
dallowed Detecting Line Segments (LS) • Compute Canny edges • Modified Douglas-Peucker algorithm to detect line segments • Vertical LS: slope within ±5° of vertical direction • Horizontal LS: Slope within ±45° of horizontal direction • 3. Pruning line segments (320x240) • Vertical LS: length 60 pixels • Horizontal LS: length 15 pixels • Vanishing point (height selection):The vanishing point is computed as the mean of the intersection of pairs of non-vertical lines
dallowed Detecting Line Segments (LS) • Compute Canny edges • Modified Douglas-Peucker algorithm to detect line segments • Vertical LS: slope within ±5° of vertical direction • Horizontal LS: Slope within ±45° of horizontal direction • 3. Pruning line segments (320x240) • Vertical LS: length 60 pixels • Horizontal LS: length 15 pixels • Vanishing point (height selection):The vanishing point is computed as the mean of the intersection of pairs of non-vertical lines
Outline • Previous work • Detecting Line Segments • Score model for Evaluating Line Segments • Structure Score • Bottom Score • Homogenous Score • Experimental Results • Conclusion
Score Model Weights • is assigned to each horizontal line segment and we use a threshold to select those ones that beyond the Structure Score Homogeneous Score Bottom Score
Score Model – Structure Structure =>Threshold=? Given a typical corridor image
Score Model – Structure Structure =>Threshold=? Given a typical corridor image Find gradient magnitude greater than a threshold T1
Score Model – Structure Structure =>Threshold=? • Given a typical corridor image • Find gradient magnitude greater than a threshold T1 • Find gradient magnitude greater than a threshold T1 and intensity less than a threshold T2. The figure shows the mask pixels image. • We have a training data over 200 images to determine T1 and T2 by SVM over 800 points.
Score Model – Structure Structure =>Threshold= TLC Given a typical corridor image Find gradient magnitude greater than a threshold T1 Find gradient magnitude greater than a threshold T1 and intensity less than a threshold T2. The figure shows the mask pixels image. Compute the average intensity of the make pixels image over original image and get a threshold value TLC
Score Model – Structure Structure =>Threshold= TLC Given a typical corridor image Find gradient magnitude greater than a threshold T1 Find gradient magnitude greater than a threshold T1 and intensity less than a threshold T2. The figure shows the mask pixels image Compute the average intensity of the make pixels image over original image and get a threshold value TLC Compute the distance between the line segments and structure blocks
Score Model – Structure Comparison of different threshold methods Ridler-Calvard Otsu Our method is able to get rid of the spurious pixels on the floor caused by reflections or shadows Our method
Outline • Previous work • Detecting Line Segments • Score model for Evaluating Line Segments • Structure Score • Bottom Score • Homogenous Score • Experimental Results • Conclusion
Score Model – Bottom Using vertical and horizontal line segments Connect each bottom point of the vertical line segments as a “bottom” wall-floor boundary
Score Model – Bottom Using vertical and horizontal line segments Connect each bottom point of the vertical line segments as a “bottom” wall-floor boundary Compute the distance of each horizontal lines segments to the “bottom” wall-floor boundary (red circled horizontal line segments indicates a positive contribution)
Outline • Previous work • Detecting Line Segments • Score model for Evaluating Line Segments • Structure Score • Bottom Score • Homogenous Score • Experimental Results • Conclusion
Score Model – Homogeneous Using efficient graph-based segmentation ( Felzenszwalb [5]), we may get a bigger segmented area in floor area, due to decorations, posters, windows etc. on the wall. Compute the ratio of area of the segmented region below a horizontal line segment over the biggest segmented region in the image. The ratio is assigned to each horizontal line segment as a homogenous score.
Detecting wall-floor boundary Given a threshold to the sum of each score Connect the remaining line segments and extend the endpoints to the edges of the image Future work: A larger database and AdaBoost algorithm to generate weights for each score
Outline • Previous work • Detecting Line Segments • Score model for Evaluating Line Segments • Structure Score • Bottom Score • Homogenous Score • Experimental Results • Conclusion
Evaluation Criterion • Wall- floor Boundary • Green line: Detected wall-floor boundary • Red line: Ground truth
Evaluation Criterion • Wall- floor Boundary • Green line: Detected wall-floor boundary • Red line: Ground truth • Area • Blue shade area: misclassified area • Red shade area: ground truth floor area • Error Rate
Sample Results Corridor images from our database
Sample Results Images download from internet.
Sample Results Lee’s Original Image Ours Some successful results of failure examples from Lee[1].
Sample Results Texture wall Checked floor Overly dark Bright lights Failure examples
Sample Results Video clip 1
Sample Results Video clip 2
Outline • Previous work • Detecting Line Segments • Score model for Evaluating Line Segments • Structure Score • Bottom Score • Homogenous Score • Experimental Results • Conclusion
Conclusion • Summaries • Over 90% of the corridor images in our database can be correctly detected. • Speed: around 7 frame/sec. • Weakness: not robust to highly textured floor, low resolution and dark environment. • Future work • Speed up the current algorithm • Improving score model by add more visual cues • Mapping the whole corridor structure for robot navigation • …
Acknowledgement • Clemson Computer Vision Group reviewers • Zhichao Chen • Vidya Murali • Anonymous reviewers