Download
1 / 47
470 likes | 644 Vues
This project implemented an automated data collection system for a mock fermentation vessel, using new hardware and LabVIEW software to record and analyze results efficiently. The system allows real-time data display and Excel recording for analysis by senior chemical engineering students and faculty members. The project incorporated user knowledge and environmental stability in the laboratory setting while ensuring equipment compatibility and safety procedures. Future steps include reviewing manuals with the client and implementing feedback for an enhanced user experience.

E N D
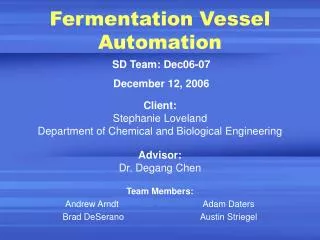
Fermentation Vessel Automation SD Team: Dec06-07 December 12, 2006 Client: Stephanie Loveland Department of Chemical and Biological Engineering Team Members: Andrew Arndt Adam Daters Brad DeSerano Austin Striegel Advisor: Dr. Degang Chen
Presentation Outline • Project Overview • Research Activities • Hardware Configuration • Software Development • Implementation • Resources and Scheduling • Lessons Learned • Closing Remarks • Questions
Acknowledgements • Stephanie Loveland • Provided finances, design specifications, and requirements for the project • Dr. Degang Chen • Technical and practical advice
Definitions • DAQ – Data acquisition • Flash – Animated graphics technology and format from Macromedia • GUI – Graphical user interface • LabVIEW – Laboratory Virtual Instrument Engineering Workbench • PPM – Parts per million • RPM – Rotations per minute • RS232 – Standard for serial cable interface • SCC – Signal conditioning system offered by National Instruments • SLM – Standard liters per minute • VI (virtual instruments) – Sub-unit program in LabVIEW that represents the appearance and function of a physical implement
Problem Statement • A mock fermentation vessel is available for use by senior chemical engineering students • Simple methods were used to record data (Paper and Pencil) • An automated data collection system needed to be developed to gather the data • Upgrade equipment as needed
Problem Solution-Approach • Designed and installed new hardware for the mock fermentation vessel apparatus • Data acquisition card • Signal conditioning modules • Oxygen concentration meter • Created automatic data collection software with LabVIEW • Recorded results with software to Excel workbook
Problem Solution-Approach Equipment Data Recorded
Intended Users • Senior level students in the Department of Chemical and Biological Engineering as well as faculty in the department • Users must have knowledge of safety procedures and requirements while conducting experiments within the lab • Users will need to have been exposed to the concepts that the lab is designed to simulate
Intended Uses • Automate the collection of the data from the mock fermentation vessel apparatus • Display data in real-time • Record data into Excel workbook for further analysis • Use of this system is not supported on any other equipment not supported
Operating Environment • Location in 2059 Sweeney • Temperature controlled environment • 60°F to 80°F Laboratory Apparatus
Assumptions (1/2) • The end-user of this project will be someone who is familiar with the fermentation process • Only one experiment will be conducted at a time • Environmental stability of 2059 Sweeney will be maintained • All new components and cables will be paid for by the client • All laboratory components will operate within their given rated power values
Assumptions (2/2) • A computer will be supplied by the client with LabVIEW and Excel already installed • An extra PCI slot will be available on the computer for data acquisition card • The data acquisition card will supply its own clock
Limitations (1/2) • File format type is in Excel format • Software shall be written using LabVIEW • One sample every five second must be recorded from each specified device • Maximum flow rate for the air/nitrogen must be less than 6 SLM • Motor speed must be kept less than 800 RPM • Safety glasses must be worn at all times when working in 2059 Sweeney
Limitations (2/2) • No more than 4 significant digits stored upon measurement • The voltage signals from the stirrer motor control must be electrically isolated • The oxygen concentration meter must read from 0 to 9.5 PPM dissolved oxygen • The oxygen concentration meter must be a benchtop unit
End Product and Deliverables • A fully automated and integrated data collection system • A graphical user interface (GUI) designed in LabVIEW • Instruction manual and documentation for the data collection system
Present Accomplishments • Purchased and installed all hardware for automated data collection • Collected data from each piece of lab equipment • Tested functionality of software as a team • Tested functionality of software with intended users, received feedback • Delivered completed software with software feedback implemented
Future Required Activities • Review user manual with client • Review programmer’s manual with client
Technology Considerations (1/4) • Data Acquisition Board • Signal Conditioning • Oxygen Concentration Meter
Technology Considerations (2/4) Data Acquisition Board • USB DAQ • Inexpensive and Easy Connection • No Signal Conditioning Capability • PXI DAQ System • High Resolution/High Sampling Rate • High Cost • Signal Conditioning Capability Technology Selected: PCI DAQ Board • PCI DAQ Board • Moderate Resolution & Sampling Rate • Moderate Cost • Signal Conditioning Capability
Technology Considerations (3/4) Signal Conditioning • No Signal Conditioning • Less Cost • Unable to interface directly with DAQ board • Signal Conditioning • Isolation requirements met for Stirrer Motor Control • Easy interface with DAQ board • Extra cost of Signal Conditioning Carrier Box Technology Selected: Signal Conditioning
Technology Considerations (4/4) Oxygen Concentration Meter • Omega DOB-930 • 100 data point logging • RS232 Interface • Limited support and availability Technology Selected: Thermo Electron Orion 3-Star • Thermo Electron Orion 3-Star • 200 data point logging • RS232 Interface • 3-year Extended Warranty and availability up to 5 years
Detailed Design (1/8) Hardware Data Flow Configuration
Detailed Design (2/8) Oxygen Concentration Meter and Interface • Thermo Electron Orion 3-Star • Full Scale Measurement of Dissolved Oxygen (0-9.5 PPM) • Interface • Onboard RS232 Connection port for data acquisition • Meter is configured to transfer data every 5 seconds to the PC • Data is acquired using the onboard COM port of the computer supplied
Detailed Design (3/8) Mass Gas Flow Meter and Interface • Omega FMA-5610 • Full Scale Measurement of Gas Flow from 0 to 10 SLM • Analog 0-5V Output Signal • Interface • 9-Pin D Connector: Pins 2-3 voltage output • SCC-AI04 is used to isolate and condition the 0-5V signal • SCC Module is plugged into the SCC Carrier for interface with the DAQ board
Detailed Design (4/8) Signal Conditioning Carrier Unit • SCC Carrier SC-2345 • Direct Cabling to the M-Series DAQ Board • Housing for up to 20 SCC Modules • Powered by DAQ Board with 5V Signal • Interface • Connects to the DAQ board via a 68 pin shielded connector cable
Detailed Design (5/8) Stirrer Motor Control and Interface • Glas-Col GKH-Stir Tester • Two analog voltage outputs (0-5V) • Operates with a floating ground at 70-90V • 60V fast transient spikes on voltage lines • Interface • 4 pin terminal connection (Differential Voltage) • SCC-AI04 is used to isolate the analog input up to 300V • Voltages are measured differentially to protect against transient spikes • SCC Module is plugged into the SCC Carrier to interface with the DAQ board
Detailed Design (6/8) Data Acquisition Card • Interface • Connects with the Signal Conditioning Carrier via the 68 pin shielded cable • Supplies internal clock for data acquisition of signals • 6 Channels of analog inputs are used for acquiring mass gas flow, torque, and speed • Automatic VI’s in LabVIEW define the operation of the DAQ card • NI PCI-6221 M-Series DAQ Board • 16 Analog Inputs, 2 Analog Outputs, 24 Digital I/O Lines, 2 Counters/Timers • 16 Bit Resolution – Accuracy of 70μV • Sampling Rate: 250 kilo-samples/sec
Detailed Design (7/8) Software Design and Implementation
Detailed Design (8/8) Software Interface
Implementation Activities • Determined scaling of devices for proper measurement • Determined proper connection for obtaining stirrer motor control data • No documentation • Contacted manufacturer and obtained more information • Used multimeter to determine correct wiring • Added multiple tab data writing after obtaining beta testing feedback
Testing Activities • Team Testing • Individual unit testing • Overall GUI functionality testing • Beta Testing • Student testing with actual laboratory experiments • Four groups of students tested • Surveys filled out by each group • Changes applied from feedback: • Experiment data on a new worksheet in an Excel file
Resources Personnel Hours
Resources Other Resources
Resources Financial Resources
Project Evaluation (1/2) • Technology Research and Selection • 100% Completed • Design • 100% Completed • Implementation • 100% Completed • Testing • 100% Completed • Documentation • 100% Completed
Project Evaluation (2/2) With a score above 90%, the project has fully met and exceeded all expectations Making the project a complete success Legend: Greatly Exceeded (1.1) – Minimum expectations were met with the addition of several extra features Exceeded (1.0) – Minimum expectations were met with the addition of one or more extra features Fully Met (0.9) – Minimum expectation were met Partially Met (0.5) - Some of the minimum expectations were met Not Met (0.0) – None of the minimum expectations were met
Commercialization • Project was not designed to be commercialized • With small software changes the system would be extendable to collect data from similar or newer equipment
Future Recommendations • Total automation of the system via computer controlled laboratory equipment • Current system would allow for computer control following software changes • Dependent upon client preference
Lessons Learned (1/4) Successes • Client relationship • Time management • Project completed earlier than expected • Beta testing occurred early, allowed for more changes • Advisor Advice
Lessons Learned (2/4) Setbacks • Incorrect SCC module purchased initially • Stirrer motor control pin out
Lessons Learned (3/4) Experienced Gain • LabVIEW Programming • Data acquisition and signal conditioning • Troubleshooting problems • Client relations • Delegating responsibilities • Communication skills
Lessons Learned (4/4) What we would do differently • More research into each piece of equipment • Obtain better LabVIEW reference
Risk and Risk Management • Equipment damage • Broken vessel overcome by team • Replacement ordered by client • Wrong module purchase • Initial mass gas flow module wrong input • Used stirrer motor control module during development • Team member loss • No team member lost during duration of project • Human injury • Standard safety procedures are followed by team while working in Sweeney lab
Closing Remarks • Students collected by pencil and paper data from each laboratory equipment every 10-15 seconds • An automatic data collection system was successfully created using data acquisition and LabVIEW software • Users can view real-time data, and do further analysis with electronically saved data