Download
1 / 27
270 likes | 449 Vues
Gene Structure and Identification III. Previous reading: 1.3, 9.1-9.6 10.2, 10.4, 10.6-8. BIO520 Bioinformatics Jim Lund. Solve the protein folding problem Solve the molecular docking/binding problem Develop realistic simulations of molecules in cells Simulate multicellular systems.

E N D
Gene Structure and Identification III Previous reading: 1.3, 9.1-9.6 10.2, 10.4, 10.6-8 BIO520 Bioinformatics Jim Lund
Solve the protein folding problem Solve the molecular docking/binding problem Develop realistic simulations of molecules in cells Simulate multicellular systems For real prediction we need…
Regulatory Sequences Known Consensus Sequences Consensus Sequence Generation Using functional (experimental) Data HBB as an example Promoter/Enhancer analysis
Functional sites Consensus Experimental tests Inferred sites Transcriptome analysis Gene Regulatory Sequences
http://weblogo.berkeley.edu/ Sequence Logos
PO A C G T 01 6 4 4 6 N 02 4 9 3 4 N 03 12 4 3 1 A 04 6 1 11 2 R 05 3 2 11 4 G 06 3 3 4 10 N 07 3 10 3 4 N 08 11 2 4 3 A 09 4 9 3 4 N 10 3 6 3 8 N Position Weight Matrix:
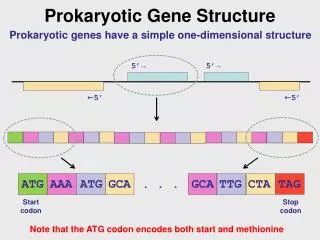
More complex signals Basal/core promoter Promoter Enhancers More genes More dispersed signals Larger promoters, distant enhancers, regulatory sites in introns. Combinatoric regulation common EUKARYOTES
TATA-box -25 to -30 TBP CCAAT-box -212 to -57 CTF/NF1 GC-box -164 to +1 SP1 K C W K Y Y Y Y +1 to +5 cap signal GC CAAT TATA Basal Promoter Analysis Myers and Maniatis, Genes VI, 831 +1
Promoter Scan TSSG/TSSW (TSSP for plants) Core-Promoter FPROM BCM Search Launcher Finding PolII sites (transcription start site)
Octamer OCT1, OCT2 B NF B ATF ATF AP1… AP1 …….. Enhancer Elements False +, False -
TRANSFAC TFD (transcription factor database) Consensus Sequence Databases
Finding sites in promoter regions: TESS http://www.cbil.upenn.edu/cgi-bin/tess/tess TFSEARCH http://www.cbrc.jp/research/db/TFSEARCH.html BCM Search Launcher http://searchlauncher.bcm.tmc.edu/seq-search/gene-search.html Consensus Sequence Databases
Genes from: Microarray transcription analysis ChIP::chip experiments Orthologous sequences Experimental/other Programs for finding consensus sites: MEME analysis of clusters AlignAce BioProspector/CompareProspector Sequence-based algorithms for identifying enhancer binding sites
Use ALL tools Predictive: Stitch together a consensus ORF finders Find patterns (and WWW pattern searches) HMM: GRAIL, Genscan… Comparative BLASTN, BLASTX Compare genomes (human:mouse) cDNA, protein, genetic evidence Practical Gene Finding
Infer Promoter, Enhancer Test in cis Genomic DNA-cDNA alignment P DNA sequencing Align (GAP) cDNA
Conservation of coding regions Identification of transcription signals “words” in common Example-yeast comparisons Comparative Genomics
Ensembl prediction pipeline DNA RepeatMasker Genscan Pmatch all human Proteins and cdnas Blast genscan peptides v Protein,unigene,est,vert mrna MiniGenewise MiniEst2genome Genes
Model both strands at once Each state may output a string of symbols (according to some probability distribution). Explicit intron/exon length modeling Advanced splice site modeling Complete intron/exon annotation for sequence Able to predict multiple genes and partial/whole genes Parameters learned from annotated genes Separate parameter training for different CpG content groups (< 43%, 43-51%, 51-57%,>57% CG content) Genscan features
Gn.Ex Type S .Begin ...End .Len Fr Ph I/Ac Do/T CodRg P.... Tscr.. ----- ---- - ------ ------ ---- -- -- ---- ---- ----- ----- ------ 7.00 Prom + 63096 63135 40 -2.75 7.01 Init + 63183 63274 92 2 2 103 77 142 0.997 14.61 7.02 Intr + 63403 63625 223 1 1 83 96 181 0.999 15.61 7.03 Term + 64524 64652 129 2 0 101 50 83 0.373 3.00 7.04 PlyA + 64758 64763 6 1.05 8.00 Prom + 70508 70547 40 -4.75 8.01 Init + 70595 70686 92 1 2 103 77 133 0.990 13.71 8.02 Intr + 70817 71039 223 2 1 100 96 217 0.999 20.91 8.03 Term + 71890 72018 129 0 0 116 43 119 0.827 7.40 8.04 PlyA + 72126 72131 6 1.05 9.00 Prom + 74399 74438 40 -8.25 9.01 Sngl + 76602 76847 246 2 0 71 50 218 0.886 11.13 9.02 PlyA + 76928 76933 6 1.05 GENSCAN predictions
HBB exons 1-3 70545..70686 70817..71039 71890..72150 HBB gene • GENSCAN • 70595 70686 • 70817 71039 • 7189072018