System Requirements
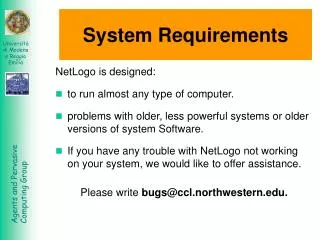
System Requirements. NetLogo is designed: to run almost any type of computer. problems with older, less powerful systems or older versions of system Software. If you have any trouble with NetLogo not working on your system, we would like to offer assistance.


System Requirements
E N D
Presentation Transcript
System Requirements NetLogo is designed: • to run almost any type of computer. • problems with older, less powerful systems or older versions of system Software. • If you have any trouble with NetLogo not working on your system, we would like to offer assistance. Please write bugs@ccl.northwestern.edu.
Application or Applet? There are two ways to run NetLogo: • Download application: this enables you to run NetLogo as a normal application. • Run applet on the web within your browser window.
Features • Running on the web is convenient, • but downloading the application has some significant advantages: • Fewer compatibility issues with various operating systems and browsers. • Starts up faster. • Models run faster. • Window is resizable. • Edit menu is available. • Keyboard shortcuts for menu items are available.
Sample Model: Wolf Sheep Predation In this Model, you open and run models: • pressing buttons, • changing slider • and switch values, • and gathering information from a model using plots and monitors.
Interface Tab • The Interface tab will fill up with lots of buttons, switches, sliders and monitors. These interface elements allow you to interact with the Model: • Buttons set up, start, and stop the model. • Sliders and Switches alter model settings. • Monitors and Plots display data. • you can use the zoom menu at the top of the window. • To begin the model, you will first need to set it up.
Controlling the Model: Buttons • When a button is pressed, the model responds with an action. • Once buttons do one action and then stop. When the action is finished, the button pops back up. • Forever buttons do an action over and over again. When you want the action to stop, press the button again. It will finish the current action, then pop back up. • Most models have a once button called "setup" and a forever button called "go". Many models also have a once button called "go once" or "step once" • You can also stop a model with the "Halt" button on the Interface toolbar. • The "Halt" button may interrupt the model in the middle of an action, and as the result the model could get confused.
Adjusting Settings: Sliders and Switches • The settings within a model give you an opportunity to work out different scenarios or hypotheses. • Altering the settings and then running the model to see how it reacts to those changes can give you a deeper understanding of the phenomena being modeled. • Switches and sliders give you access to a model's settings.
Switches • Switches are set up in an on/off format. • Switches turn on/off a separate set of directions. • These directions are usually not necessary for the model to run, but might add another dimension to the model. • Turning the "grass?" switch on affected the outcome of the model. • Prior to this run, the growth of the grass stayed constant. This is not a realistic look at the predator-prey relationship; so by setting and turning on a grass growth rate, we were able to model all three factors: sheep, wolf and grass populations.
Sliders • A slider has a range of numeric values that can be adjusted. • As you move the marker from the minimum to the maximum value, the number on the right side of the slider is currently set to. • For example, the "initial-sheep" slider has a minimum value of 0 and a maximum value of 250. The model could run with 0 sheep or it could run with 250 sheep, or anywhere in between. Try this out and see what happens.
Gathering Information: Plots and Monitors • A purpose to modeling is to gather data on a subject or topic that would be very difficult to do in a laboratory situation. • NetLogo has two main ways of displaying data to the user: plots and monitors.
Plots • The lines show what's happening in the model over time. • To see which line is which, click on "Pens" in the upper right corner of the plot window to open the plot pens legend. • To view or analyze the data from a plot in another program, you can use the "Export Plot" item on the File menu.
Monitors • The monitor labeled "time-ticks" tells us how much time has passed in the model. • The other monitors show us the population of sheep and wolves, and the amount of grass. • The numbers displayed in the monitors update continuously as the model runs.
Changing Graphics Window Settings The size of the Graphics Window is determined by three separate settings: Screen Edge X, Screen Edge Y, and Patch Size.
The Models Library The Library contains four sections: • Sample Models The Sample Models section is organized by subject area. • Code Examples These are simple demonstrations of particular features of NetLogo. • HubNet Activities This section contains participatory simulations for use in the classroom. • Unverified Models These models are still in the process of being tested and reviewed for content and accuracy.
Sample Model: Traffic Basic In this Model, the focus will start to shift from observing models to manipulating models.
The Command Center • The Command Center allows you to enter commands or directions to the model. • Commands are instructions you can give to: turtles, patches, and the observer. 2 1 4 3
Working With Colors • In NetLogo, all colors have a numeric value. • In all of the exercises we have been using the name of the color (16).
Agent Monitors • We used the set command to change the colors of all the cars. • Let's look at how to change only one car's color. • Click on the red car with the right mouse button. • From the popup menu, choose "inspect turtle 0" • We can see all of the variables of the red car. • The value of variable can be changed.
Agent Commanders • An Agent Commander found at the bottom of an Agent Monitor. • You type commands here, just like in the Command Center, but the commands you type here are only done by this particular turtle. • Idem for Patches
Procedures The heart of a NetLogo Model is the Procedures tab. • Keep in mind how people usually think of these three different kinds of agents: • The turtles and patches mostly use information about what's close to them. • The observer typically uses and accesses the whole world. • While patches can't move and often represent some sort of environment, turtles can move around in the world.
Setup and Go • To start a new model, select "New" from the File menu. • Then create a once-button called 'setup'. • Now you have a button called 'setup'. It will execute the procedure 'setup' when pressed, • set up the NetLogo world.
Setup • Now switch to the Procedures Tab and create the 'setup' procedure shown below.
Press your 'setup' • Press your 'setup' button when you're done writing the code.
Go • Make a forever-button called 'go'. Again, begin by creating a button, but this time check the "forever" checkbox in the edit window. to go move-turtles end to move-turtles ask turtles [ set heading (random 360) fd 1 ] end
Patches and Variables Now you've got 100 turtles aimlessly moving around, completely unaware of anything else around them. Let's give these turtles a nice background against which to move: patches-own [elevation] to setup ca setup-patches setup-turtles end
Patches and Variables to setup-patches ask patches [ set elevation (random 10000) ] diffuse elevation 1 ask patches [ set pcolor scale-color green elevation 1000 9000 ] end to setup-turtles crt 100 ask turtles [ fd (random screen-edge-x) ] end
Landscape • Press the 'setup' button back in the model's interface. • Voila! A lush NetLogo landscape complete with turtles and patches appears.
Globals globals [highest lowest] ;; highest and lowest patch elevation to setup-patches ask patches [ set elevation (random 10000) ] diffuse elevation 1 ask patches [ set pcolor scale-color green elevation 1000 9000 ] set highest max values-from patches [elevation] set lowest min values-from patches [elevation] ask patches [ if (elevation > (highest - 100)) [set pcolor white] if (elevation <(lowest + 100)) [set pcolor black] ] end
Simple Algorithm to move-turtles ask turtles [ set heading (random 360) fd 1] end • the turtles cannot see ahead farther than just one patch; • each turtle can move only one square each turn; • turtles are blissfully ignorant of each other.
An Uphill Algorithm ;; each turtle goes to the highest elevation in a radius of one to move-to-local-max ask turtles [ set heading uphill elevation if ( elevation-of patch-at dx dy > elevation ) [ fd 1 ]] end • If none of the patches around it have a higher elevation than the patch it is on, it'll stay put. • Our turtles rapidly arrive at local maxima in our landscape.
An Uphill Algorithm • Our goal is to still get the turtles to find an 'optimal maximum', which is one of the white patches. to recolor-patches ask patches [ set elevation pycor set pcolor scale-color green elevation (0 - screen-edge-y) screen-edge-y] end After Replace the line: diffuse elevation 1 with repeat 5 [ diffuse elevation 1 ]
Plot • NetLogo allows us to plot data as we go along. • To make plotting work, we'll need to create a plot in the Interface tab, and set some settings in it. • Then we'll add one more procedure to the Procedures tab, which will update the plot for us. to do-plots set-current-plot "Turtles at Peaks" plot count turtles with [ elevation >= (highest - 100) ] end
Plot • The plot primitive adds the next point to a plot. • we need to tell NetLogo which plot we want update.
HubNet • HubNet is a technology that lets you use NetLogo to run participatory simulationsin the classroom. • In a participatory simulation, a whole class takes part in enacting the behavior of a system as each student controls a part of the system by using an individual device, such as a TI-83+ calculator or a networked computer. • For example, in the Gridlock simulation, each student controls a traffic light in a simulated city.
BehaviorSpace • BehaviorSpace is a software tool integrated with NetLogo that allows you to perform experiments with models. • It systematically varying the values of sliders and records the results of each corresponding model run. • This way you can explore the model's "space" of possible behaviors and determine which combinations of slider values cause the behaviors of interest.
References In the Netlogo site you can find: • the last version of Netlogo • the Netlogo User Manual • the new Netlogo model • and a group-discussion about Netlogo http://www.ccl.sesp.northwestern.edu/netlogo/